
A fund showing an 80% “distribution rate” creates an obvious question: if earning 80% were repeatable, why would anyone own anything else?
The answer is that a distribution rate is not an investment return. It annualizes a recent cash payment. That cash may come from option premium, realized gains, income—or your own capital being returned. Meanwhile, the share price can fall.
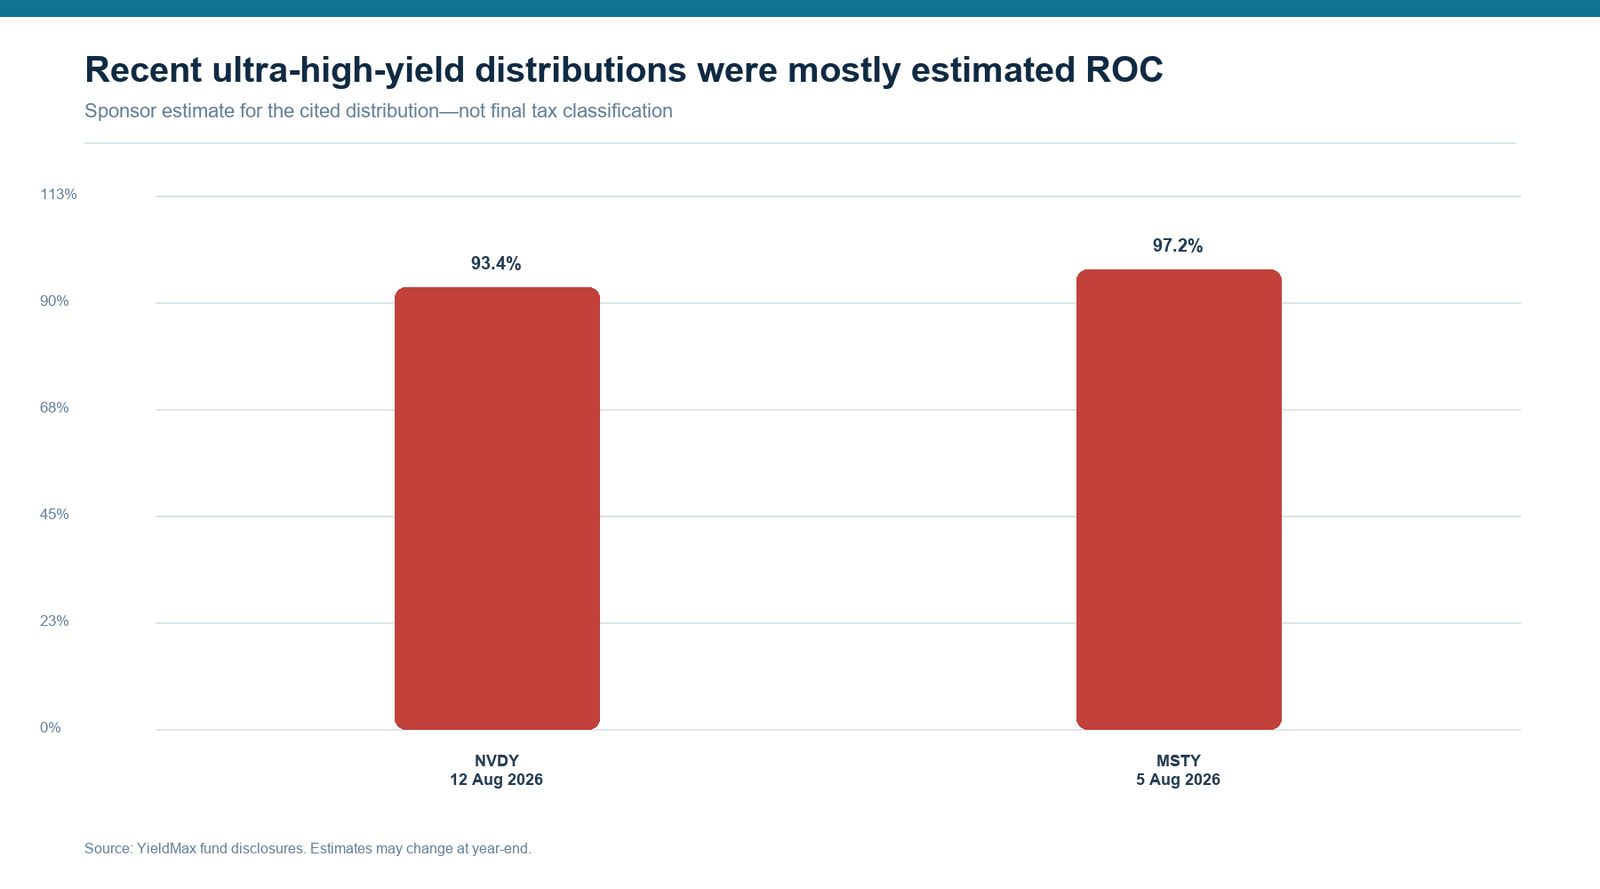
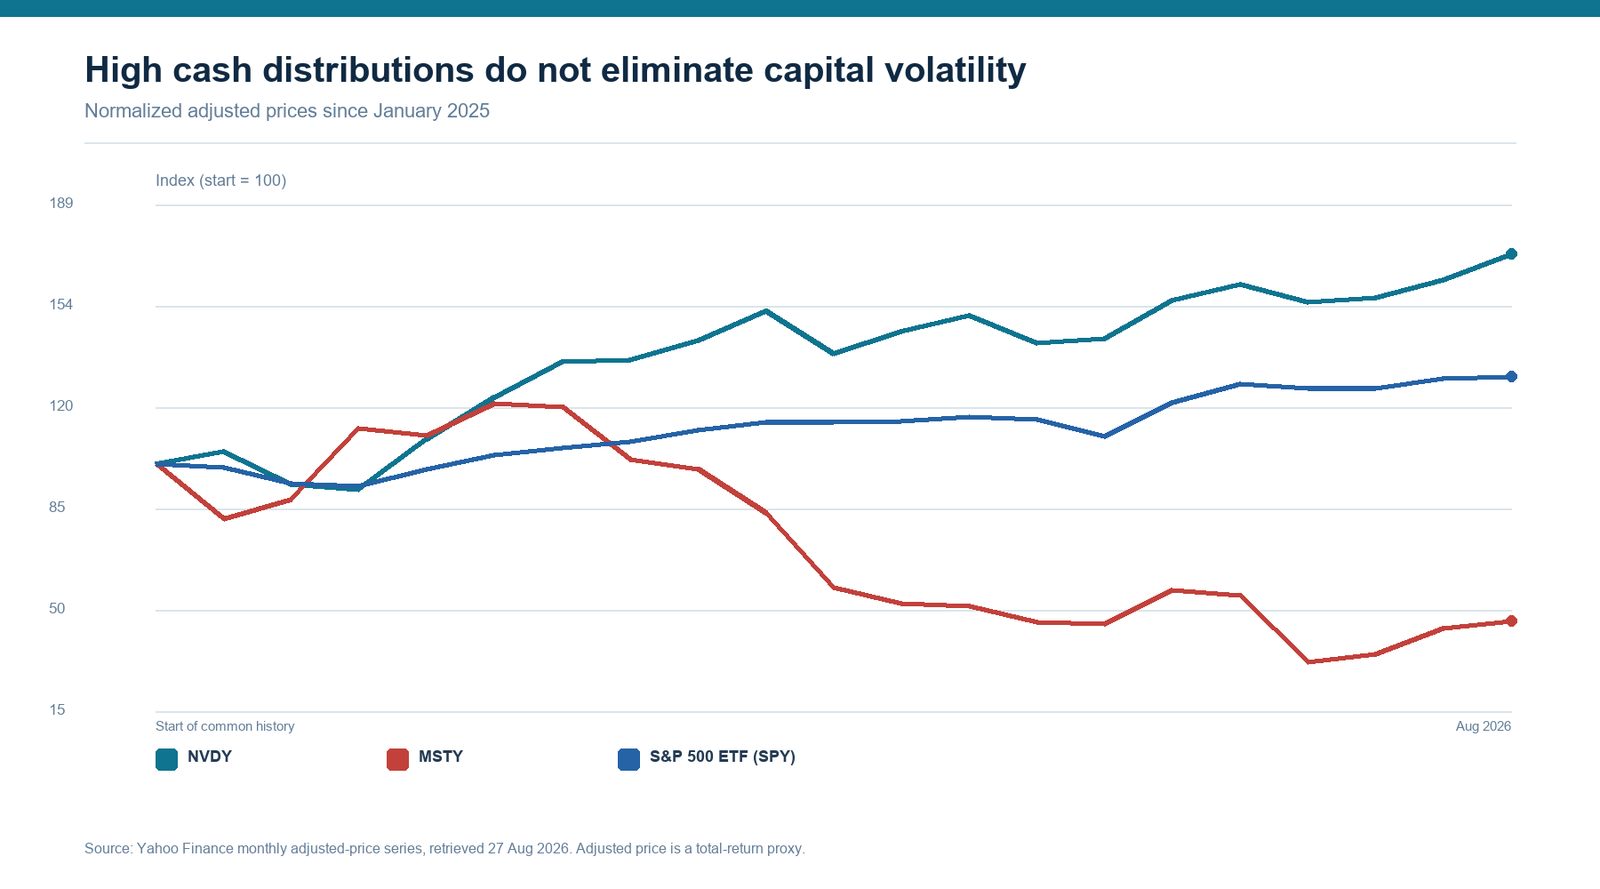
Recent sponsor estimates make the point vividly. YieldMax reported that NVDY’s August 12, 2026 distribution contained an estimated 93.36% return of capital; MSTY’s August 5 distribution was estimated at 97.24%. These estimates can change at tax reporting, and return of capital is not automatically destructive. But ignoring it is dangerous.
Distribution rate, yield and total return are different
| Measure | What it tells you | What it hides |
|---|---|---|
| Distribution rate | Latest payment annualized relative to price/NAV | Variability, source of cash, price loss |
| SEC yield | Standardized recent portfolio income | Option gains and future changes |
| Total return | Price/NAV change plus reinvested distributions | Your personal taxes and timing |
| Return of capital | Tax classification or estimate | Whether it was constructive or destructive |
How option-income ETFs manufacture cash
Single-stock option ETFs commonly obtain synthetic exposure to a volatile company and sell calls against it. The premium becomes distributable cash, but the call also sells away part of the upside. If the underlying stock plunges, the premium provides only a limited cushion. If it surges, the fund may participate incompletely. The result can be the worst psychological combination: exciting cash payments and disappointing wealth creation.
Return of capital is a clue, not a verdict
Constructive ROC can arise from timing differences or tax management. Destructive ROC occurs when a fund distributes more than its strategy economically earns and NAV trends downward after adjusting for markets. The practical test is not “Was there ROC?” It is: Did NAV and total return remain resilient through a full market cycle?
A seven-point forensic checklist
- Chart NAV since inception, not only market price.
- Calculate total return with distributions reinvested.
- Compare with the underlying stock and a plain index.
- Read every 19a notice and year-end tax classification.
- Measure upside and downside capture.
- Check reverse splits and falling distributions per original share.
- Ask whether the strategy still works if volatility falls.
Who should stay away?
Investors who need a stable pension-like payment, do not understand options, or judge success by cash received should avoid making these funds a core holding. A fluctuating weekly distribution is not a salary. European investors must also consider product access and local tax rules; see our UCITS dividend ETF guide and withholding-tax guide.
A more durable portfolio role
If used at all, treat an ultra-high-yield ETF as a satellite position with a maximum allocation, a total-return benchmark and an exit rule. Pair the analysis with our guides to safe high yields, dividend ETFs and living off dividends.
Bottom line
The cash is real. The advertised “yield” may not be. Before buying any 30%, 50% or 80% distribution product, replace the question “How much does it pay?” with “How much wealth did it create after paying me?”
The professional due-diligence test
The return-of-capital chart is a snapshot; the adjusted-price chart supplies context. Neither is sufficient alone. ROC can be tax-efficient, while adjusted price can be influenced by an unusually favorable or unfavorable underlying stock. Together they force the right question: did the strategy create competitive wealth for the risk taken?
Editorial view: An annualized distribution rate should never appear in an investment memo without total return, NAV change, benchmark return and distribution composition beside it.
Red-flag sequence
Concern rises when four signals appear together: recurring high ROC estimates, declining NAV, distributions per original share trending lower and repeated reverse splits. One signal may be explainable; the cluster suggests the fund is distributing faster than it creates durable value.
For ongoing monitoring, save each 19a notice, reconcile it with the year-end tax form and calculate returns from the same starting date. If the fund cannot beat a simpler benchmark after tax and risk, the complexity is not earning its place.
Sources
Fund-specific figures and warnings: official NVDY and MSTY disclosures, checked August 2026. Tax classifications may be revised.
Worked example: the difference between income and liquidation
Suppose a $10,000 position distributes $4,000 during a year but ends with NAV of $6,800. Before tax, the investor has $10,800—an 8% total return, not 40%. If NAV ends at $5,500, the same cash payment leaves only $9,500, a 5% loss. The bank account received money in both cases, but only one created wealth.
Now add tax. If distributions are taxed before the investor can reinvest them, a high-turnover cash strategy may compound less efficiently than a fund that retains more value in NAV. Tax rules vary, so this is a question for a local adviser rather than a universal conclusion.
What a reverse split tells you
A reverse split does not itself destroy value; ten $5 shares becoming one $50 share is mathematically neutral. But repeated reverse splits can reveal long-term NAV erosion. Investors should reconstruct the original-share distribution history so a cosmetically higher post-split share price does not hide declining economic payments.
Constructive versus destructive ROC
| Signal | Potentially constructive | Potentially destructive |
|---|---|---|
| NAV | Stable or growing through a cycle | Persistent decline beyond benchmark |
| Total return | Competitive after distributions | Lags underlying by a wide margin |
| Distribution | Supported by realized economics | Repeatedly exceeds strategy earnings |
| Tax | Defers basis in a useful way | Tax benefit masks capital loss |
Frequently asked questions
Is return of capital free money?
No. It generally reduces cost basis and may defer tax, but it does not create value by itself.
Can an ultra-high-yield ETF outperform?
Yes, in a favorable volatility and price path. The problem is treating a recent annualized distribution as a dependable forecast.
Should distributions be reinvested?
Reinvestment makes total-return comparison cleaner, but automatically buying more of an eroding strategy can compound the mistake. Reassess NAV, benchmark-relative performance and thesis first.
What is the decisive document?
Use the prospectus for strategy risk, sponsor distribution notices for estimates, annual tax forms for final classification and audited reports for realized results. Marketing pages alone are insufficient.