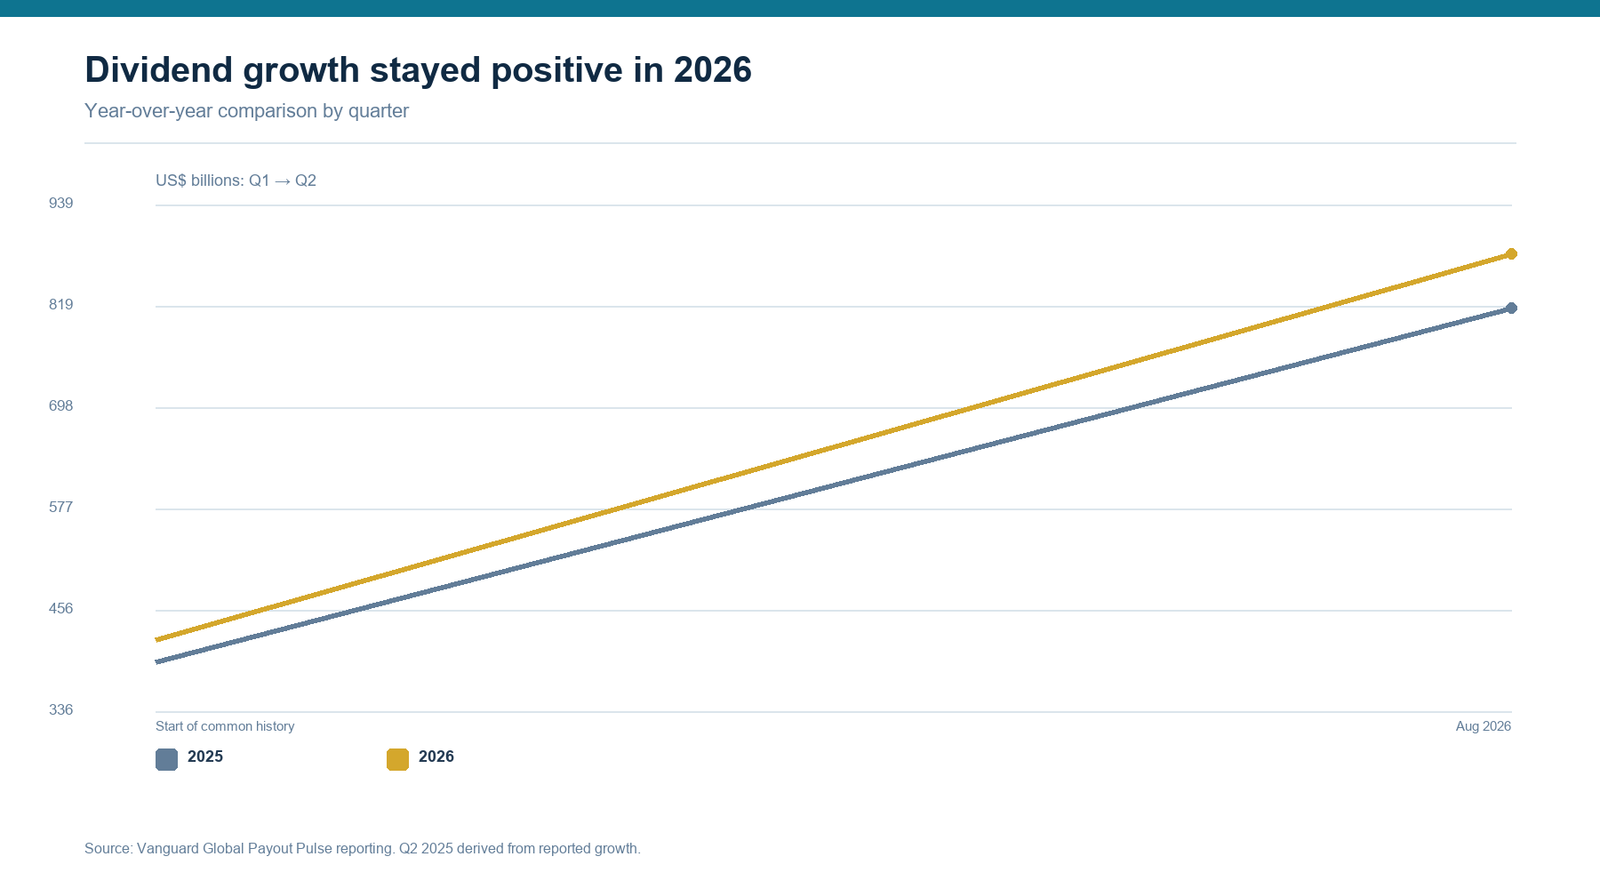
Global companies paid shareholders a record $881 billion in the second quarter of 2026, according to Vanguard’s Global Payout Pulse reporting—8% more than a year earlier. The first quarter had already set a record at $421 billion, up 6.7% from $394 billion.
That sounds like an all-clear signal for income investors. It is not. Global payout growth is uneven, currencies can magnify or erase gains, and a record aggregate can coexist with dividend cuts in specific industries.
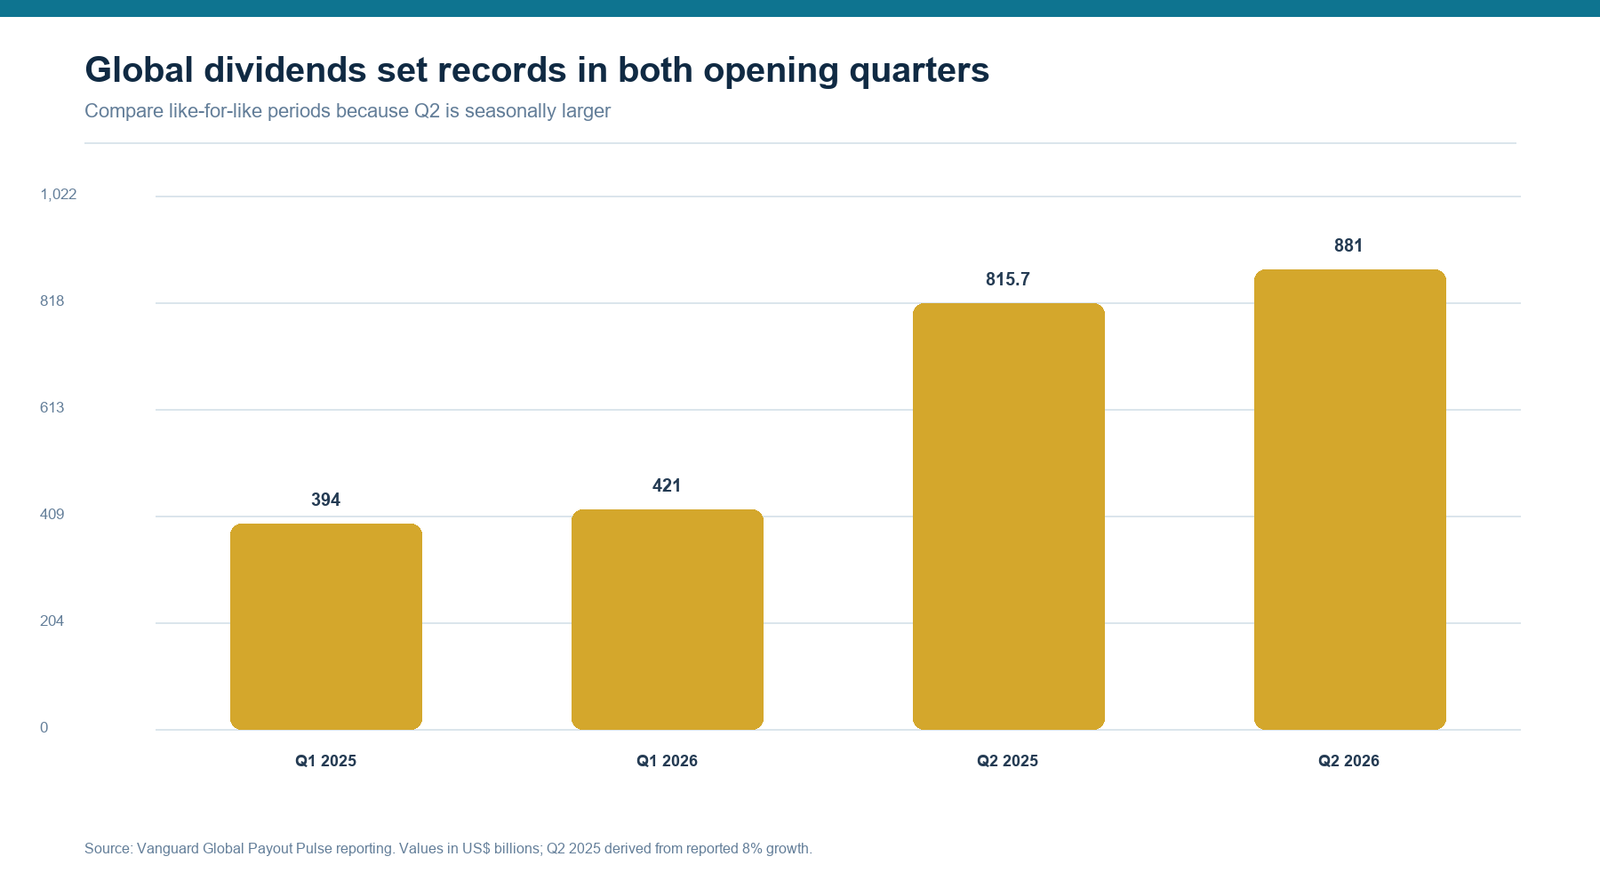
Important: Q2 is seasonally much larger than Q1 because many European companies pay annual dividends in spring. Compare Q1 with Q1 and Q2 with Q2; do not treat the jump from $421 billion to $881 billion as sequential growth.
Why payouts are rising
Three forces are doing most of the work: resilient corporate earnings, stronger European distributions and continued shareholder returns from banks, energy companies and mature technology firms. S&P Global forecast aggregate 2026 dividends of about $2.47 trillion, up 2.9% after 4.7% growth in 2025.
Regional scorecard
| Region | 2026 signal | Investor advantage | Main complication |
|---|---|---|---|
| Europe ex-UK | Very strong Q1 growth | Banks, insurers, industrials | Annual payments and withholding tax |
| United States | Broad, steadier growth | Quarterly consistency | Lower market yield and high valuations |
| United Kingdom | High-income market | Large mature payers | Sector concentration |
| Asia-Pacific | Strong but uneven | Financials and cash-rich exporters | Currency and policy variability |
| Emerging markets | Mixed | Higher yields and diversification | Commodity, currency and governance risk |
Where the growth is coming from
Financials
Banks and insurers remain important contributors where capital ratios and profitability permit distributions. The risk is that payouts are cyclical and sensitive to credit losses and regulation.
Industrials and defence
Infrastructure, electrification and defence backlogs support cash-flow visibility, although valuations have risen. Our new European defence analysis examines this theme in detail.
Technology
Mature mega-cap technology companies increasingly return cash, widening the dividend universe beyond traditional value sectors. The starting yield can be small, making dividend growth more important than immediate income.
Energy and materials
These sectors can produce enormous distributions at favorable commodity prices, then reduce them quickly. Separate base dividends from variable and special payments.
After-tax yield matters more than headline yield
A French, Swiss or Canadian dividend may be reduced at source before it reaches a foreign investor. Reclaim procedures, tax treaties and account type change the result. Use our country-by-country withholding-tax guide before comparing yields.
How to build a global dividend allocation
- Set limits by country, sector and currency.
- Blend high-yield stocks with dividend growers.
- Evaluate payout coverage using free cash flow.
- Reinvest selectively rather than automatically buying the most expensive market.
- Track total return and after-tax income in your home currency.
Our geographic research can help with the underlying selections: Canada, Australia, Nordic markets and Europe.
What could reverse the record?
S&P highlights trade tensions, geopolitical conflict, currency volatility and slower earnings growth. Add falling commodity prices, credit deterioration and excessive leverage. The most vulnerable dividends are generally those funded by peak-cycle profits or borrowing.
Bottom line
The 2026 record confirms that dividends remain a powerful global source of return. It does not justify buying the highest yield in every country. The better response is to diversify the sources of income, insist on cash-flow coverage and judge results after taxes and currency effects.
Investors turning global payouts into retirement income should continue with our retirement dividend strategy and living-off-dividends guide.
What the records mean for an actual portfolio
The bar chart protects against a common analytical mistake: comparing the seasonally small first quarter with Europe’s payment-heavy second quarter. The line chart makes the valid comparison—2026 against 2025 within the same periods.
Editorial view: Record global payouts support diversification, but they are not a timing signal. Investors should favor repeatable regular dividends over one-off specials and measure every foreign payment after withholding tax and currency conversion.
Quality filter for the next twelve months
Classify each holding as a dividend grower, stable high yielder or cyclical payer. Require free-cash-flow coverage for the first two groups and normalize commodity prices or credit losses for the third. Cap exposure to any one country, sector and currency so a regional record does not become a concentrated bet.
The most useful follow-up metric is not the global headline total. It is the growth of regular dividends per share in your home currency, after tax. That is the income stream an investor can actually spend.
Sources
Global figures: Vanguard Global Payout Pulse as reported in August 2026. Outlook: S&P Global’s seven dividend forecasts for 2026. Figures are nominal and can be affected by exchange rates and special dividends.
How to read global dividend data without being fooled
Headline totals are affected by exchange rates, special dividends and seasonality. Use underlying growth where available, separate regular from special payments, and compare the same quarter year over year. A stronger dollar can reduce the translated value of non-US payments even when companies raise dividends locally.
Yield versus growth by market type
| Market profile | Typical attraction | Typical risk |
|---|---|---|
| US dividend growers | Quarterly consistency and growth | Low starting yield, high valuation |
| European high yield | Stronger current income | Annual payments and cyclical cuts |
| Asia-Pacific | Value and financial-sector exposure | Variable payout policies |
| Emerging markets | Yield and diversification | Currency, governance and commodity shocks |
Portfolio stress tests
Run three simple scenarios. First, cut every cyclical dividend by 30% and see whether essential spending remains covered. Second, move foreign currencies 15% against your home currency. Third, assume no special dividends recur. A robust income plan should survive all three without forced selling.
Rebalancing when records create enthusiasm
Record payouts can attract capital after prices have already risen. Rebalance toward underrepresented regions only when payout quality and valuation justify it. Do not increase a country allocation merely because its companies made a large seasonal payment.
Frequently asked questions
Are global dividends expected to keep growing?
S&P Global forecast 2.9% aggregate growth for 2026, but that is a forecast rather than a guarantee. Earnings, currencies and special dividends can change the final result.
Which country is best for dividend investors?
No country dominates every criterion. The UK offers high yields, the US offers consistency, Australia adds franking credits for eligible residents, and continental Europe offers large annual payments with more withholding complexity.
Should investors hedge currencies?
Hedging can stabilize reported income but costs money and may remove diversification. Match the decision to future spending currency and portfolio horizon.
Are record dividends automatically bullish for stocks?
No. Dividends are backward- and present-looking cash decisions. Markets price future earnings. A record payout can occur near a cyclical peak, so balance-sheet and earnings analysis remain essential.