REIT research · 2026 field guide
The best REIT yield is not the largest number on a quote screen. It is the rent stream that still covers the dividend after maintenance, refinancing and a weaker tenant cycle.
Agree Realty is our best all-round REIT for dividend quality; Realty Income is the stronger scale-and-yield compromise. VICI offers the highest current yield but needs a tenant-concentration discount. Digital Realty is the cleaner AI choice. Equinix is the fastest grower here, yet at a roughly 2% yield it is not a high-yield stock.
That conclusion comes from a deliberately unfashionable test. We started with the cash left after property-level realities, not the distribution rate. Then we asked what that cash flow costs at today’s share price. The result is a list that refuses to put a 7% gaming landlord and a 2% data-center compounder in the same bucket merely because both elect REIT status.
This article also separates the REITs that produce income now from the digital landlords that may grow into a larger dividend later. Readers focused on payment frequency can compare our broader list of monthly dividend stocks; this ranking is about durability and prospective return, not the calendar.
Reading note. “Yield” annualizes the latest declared regular dividend against the 4 September close. “Payout” uses the dividend attributable to Q2 divided by Q2 AFFO, except STAG and Digital Realty, where Core FFO is the cleaner disclosed denominator. These are non-GAAP measures and definitions differ by issuer.
Our 2026 high-yield REIT ranking
We rank the securities for an income investor who still cares about total return. That means a low-yielding growth REIT can make the list, but it cannot quietly win a “high-yield” contest on brand quality alone. Conversely, VICI’s 7.2% indicated yield earns attention, not an automatic first place.
| Rank | Property type | Price | Indicated yield | Q2 payout | Net leverage | Ops/share YoY | P/2026E* | 1Y adj. return |
|---|---|---|---|---|---|---|---|---|
| 1ADC | Retail net lease | $72.62 | 4.4% | 70.3% | 5.2x | 7.4% | 15.9x | +5.2% |
| 2O | Diversified net lease | $61.25 | 5.3% | 74.5% | 5.4x | 3.8% | 13.8x | +10.8% |
| 3VICI | Gaming and experiential net lease | $25.42 | 7.2% | 72.6% | 4.9x | 4.6% | 10.3x | -19.2% |
| 4DLR | Data centers | $188.39 | 2.6% | 57.3% | 4.7x | 13.9% | 23.0x | +19.0% |
| 5WPC | Industrial and diversified net lease | $70.38 | 5.3% | 70.1% | 5.5x | 4.7% | 13.5x | +11.1% |
| 6STAG | Single-tenant industrial | $37.68 | 4.1% | 59.6% | 5.2x | 3.2% | 14.5x | +6.1% |
| 7EQIX | Interconnection data centers | $1,035.98 | 2.0% | 43.8% | n/c | 19.0% | 24.1x | +37.8% |
A 70.3% Q2 AFFO payout and 7.4% AFFO-per-share growth leave room for mistakes.
A 5.3% indicated yield, 15,588 properties and a still-covered monthly dividend.
The cheapest multiple and highest yield in the group—but also the clearest concentration question.
Fast core FFO growth, a 57.3% payout and a record signed backlog.
Why AFFO—not EPS—does the heavy lifting
Real estate accounting begins with a mismatch. A building is depreciated on a schedule even when its economic value or rent is rising. Nareit’s FFO definition therefore starts with GAAP net income, adds back real-estate depreciation and removes certain property-sale gains or losses. It is a better operating lens than EPS, but it is not cash in a bank account.
AFFO tries to move one step closer to recurring distributable economics by adjusting for straight-line rent and recurring capital needs. There is an important catch: AFFO is not standardized. A precise-looking 70% from one company is not perfectly interchangeable with 70% from another. We use each issuer’s reconciliation, flag the two Core FFO exceptions and avoid false decimal-point confidence.
Quarterly dividend ÷ AFFO or Core FFO. Below 75% is our preferred starting zone, not a guarantee.
Net debt relative to recurring EBITDA, refinancing schedule and liquidity.
Occupancy, cash leasing spreads, escalators and tenant credit—not acquisition volume alone.
Current yield and price-to-guidance or run-rate operating earnings.
The legal 90% rule is not a dividend-safety rule. The IRS qualification test is based on REIT taxable income, not AFFO. A company may distribute far less—or more—than 90% of AFFO. That is why a generic EPS payout ratio can make a sound REIT look reckless, while a headline yield can make a fragile one look generous.
The market already separated AI growth from rent checks
Over the year through 4 September, Equinix and Digital Realty outran the seven-name group, while VICI lost value even after adjusting for distributions. That does not prove which stock wins next. It does show what the market is pricing: visible digital-infrastructure growth deserves a premium; a high current yield without a clean narrative can become a warning label.
AI infrastructure won the year; VICI’s yield did not
Growth of $10,000 · adjusted-close proxy · 4 Sep 2025–4 Sep 2026
Swipe horizontally to inspect the full chart.
Source: original calculations from Yahoo Finance daily adjusted closes, 4 September 2025–4 September 2026. VNQ is the Vanguard Real Estate ETF benchmark. Adjusted close is a distribution-adjusted market-price proxy, before taxes, fees and FX; it is not property NAV or a guaranteed investor return.
View exact chart data
| Ticker | Ending value | Adjusted return | Price return | Max drawdown |
|---|---|---|---|---|
| ADC | $10,523 | +5.2% | +0.9% | -11.1% |
| O | $11,083 | +10.8% | +5.1% | -11.1% |
| VICI | $8,079 | -19.2% | -24.1% | -19.4% |
| DLR | $11,903 | +19.0% | +15.7% | -16.8% |
| WPC | $11,107 | +11.1% | +5.2% | -9.7% |
| STAG | $10,605 | +6.1% | +2.5% | -13.5% |
| EQIX | $13,779 | +37.8% | +34.9% | -13.7% |
| VNQ | $10,908 | +9.1% | +5.0% | -8.3% |
There is another useful reading. Realty Income and W. P. Carey delivered respectable distribution-adjusted returns without the AI multiple. Their outcome came from a more ordinary combination of income, modest cash-flow growth and valuation. That is less exciting—and often exactly what an income sleeve is supposed to do.
The payout chart says the dividend problem is not today
Every company in this screen covered its Q2 regular dividend on the selected recurring operating measure. Digital Realty and Equinix have the widest numerical cushions; STAG also looks conservative. Yet coverage is only the first gate. Data-center cash flows demand heavy development capital, and an industrial landlord can carry a low payout while occupancy weakens. Cushion tells us how much can go wrong before the dividend is pressured; it does not tell us what will go wrong.
Every payout cleared the first test
Q2 dividend ÷ recurring operating earnings per share · lower leaves more cushion
Swipe horizontally to inspect the full chart.
Source: original calculations from each issuer’s Q2 2026 release or supplemental. Payout = Q2 regular dividend per share ÷ Q2 AFFO per share; STAG and DLR use Core FFO, with DLR excluding net promote. The gold line marks 75%. Definitions are issuer-specific.
View exact chart data
| Ticker | Denominator | Q2 metric/share | Q2 dividend | Payout |
|---|---|---|---|---|
| ADC | AFFO | $1.14 | $0.801 | 70.3% |
| O | AFFO | $1.09 | $0.812 | 74.5% |
| VICI | AFFO | $0.62 | $0.45 | 72.6% |
| DLR | Core FFO ex-promote | $2.13 | $1.22 | 57.3% |
| WPC | AFFO | $1.34 | $0.94 | 70.1% |
| STAG | Core FFO | $0.65 | $0.3875 | 59.6% |
| EQIX | AFFO | $11.8 | $5.16 | 43.8% |
VICI deserves a footnote because its board raised the quarterly dividend to $0.46 on 3 September, after Q2. That new rate is still about 74% of Q2 AFFO, but the margin is thinner than the bar based on the $0.45 Q2 dividend. We use the new annualized $1.84 for the indicated yield and the in-period dividend for the like-for-like coverage chart.
AI data centers: own the power constraint, not the slogan
AI demand is real, but it does not turn every warehouse with servers into a superior investment. The scarce assets are powered land, grid interconnection, cooling capacity, fiber density and executed leases with creditworthy customers. A signed backlog matters more than a press release; a stabilized yield matters more than a megawatt headline.
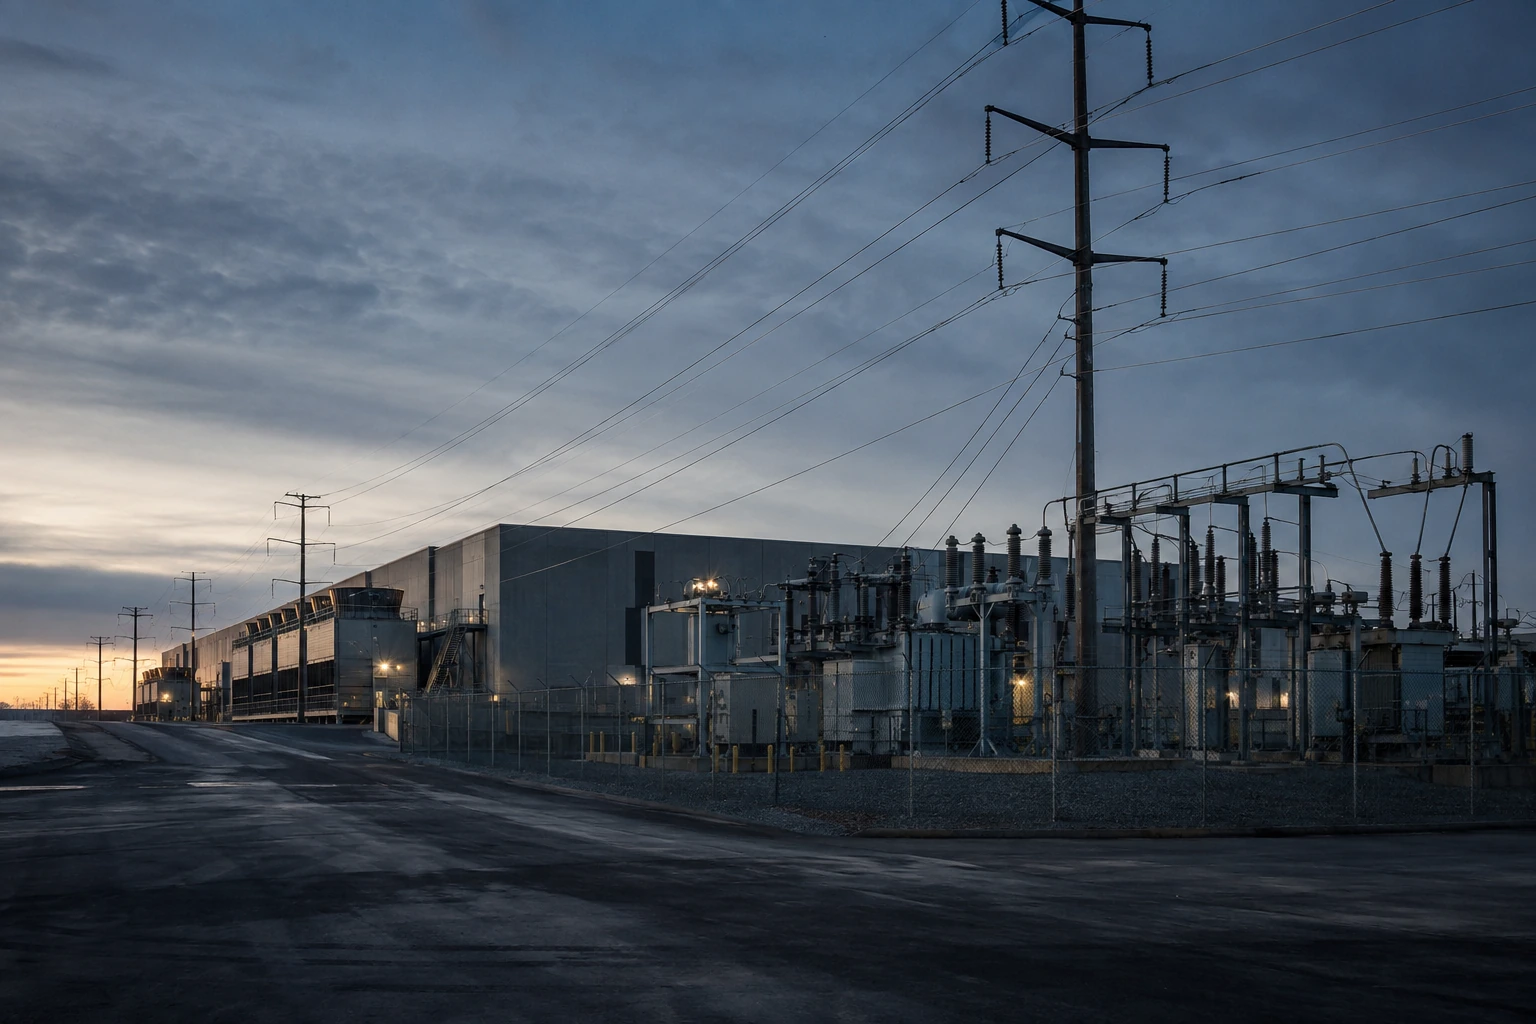
Digital Realty reported a record $1.9 billion annualized GAAP-rent backlog at 100% share, $1.4 billion at its share, plus 25.4% cash renewal spreads in Q2. It also sold $2.5 billion of stock year to date through June, a reminder that growth must be financed. Equinix reported 11% monthly recurring revenue growth, 23% booking growth and a record 9,700 net interconnections. Those operating indicators are stronger than generic “AI exposure,” but Equinix’s roughly 24-times 2026 AFFO multiple leaves less room for ordinary execution.
Realty Income is now a bridge between the two camps. Its June joint venture committed to three Northern Virginia hyperscale assets valued above $6 billion, with Realty Income expecting to invest up to $1.4 billion for a 45% equity stake. The assets are fully leased or pre-leased to investment-grade hyperscale tenants on 15- to 20-year triple-net leases. That is meaningful optionality, but not enough to reclassify a 15,588-property net-lease portfolio as an AI stock.
Income quality and AI growth are different shapes
ADC, O and DLR · five actual percentage measures · larger is not always better
Swipe horizontally to inspect the full chart.
Source: original calculations from Q2 2026 issuer disclosures and Yahoo Finance adjusted closes. Raw percentages on a common 0–180% scale—not normalized and not a quality score. Dividend coverage = operating metric ÷ dividend; ending-value retention = ending adjusted value ÷ starting value; trough retention = 100% + max drawdown; price stability = 100% − annualized adjusted-close volatility; operating growth index = 100% + Q2 per-share growth.
View exact chart data
| Actual metric | ADC | O | DLR |
|---|---|---|---|
| Dividend coverage | 142.2% | 134.2% | 174.5% |
| Ending-value retention | 105.2% | 110.8% | 119.0% |
| Trough retention | 88.9% | 88.9% | 83.2% |
| Price stability | 83.9% | 83.8% | 72.8% |
| Ops growth index | 107.4% | 103.8% | 113.9% |
The web chart is intentionally not a proprietary “score.” It places three archetypes—ADC, Realty Income and Digital Realty—on five disclosed or reproducibly calculated percentages. Digital Realty wins on payout coverage and operating growth; the two net-lease names show better one-year price stability. The right conclusion is not that one polygon is best. It is that income quality and AI torque solve different portfolio problems.
The seven REITs, from strongest fit to specialist watchlist
Agree Realty (ADC): best all-round dividend quality
Why it ranks here. Q2 AFFO per share rose 7.4% to $1.14 while the three monthly dividends consumed 70.3%. The portfolio was 99.8% leased, 65.8% of annualized base rent came from investment-grade retail tenants, and 2026 AFFO guidance rose to $4.57–$4.59 per share.
The variant view. “Retail REIT” sounds cyclical; the actual rent roll is heavy in grocery, home improvement, convenience and auto service—categories that are harder to displace with a browser tab. Management acquired at a 7.0% cash cap rate in Q2 while maintaining forward equity capacity.
First rejection test. At about 15.9 times 2026 guidance, ADC is not the cheapest name. It also had 5.2-times reported net debt to recurring EBITDA before giving credit to $1.1 billion of unsettled forward equity; the 3.7-times pro-forma figure assumes that financing settles as expected.
What would break the case. Slower AFFO growth despite equity issuance, weaker tenant credit or acquisition yields falling below the blended cost of capital. Watch AFFO per share—not portfolio size—next quarter.
Realty Income (O): the best scale-and-income compromise
Why it ranks here. The 5.3% indicated yield is backed by a 74.5% Q2 AFFO payout, 98.8% occupancy and a 102.7% rent-recapture rate. Q2 AFFO per share grew 3.8%, and management raised 2026 guidance to $4.44–$4.45.
The variant view. Realty Income’s size is often treated as a growth handicap. It can also be a financing advantage: Q2 investments totaled $2.6 billion at a 7.3% initial weighted cash yield, while the company carried a 5.4-times leverage ratio and received an A issuer rating from Fitch in August. The data-center venture widens the opportunity set without forcing the core portfolio to make an AI promise.
First rejection test. Same-store rent growth guidance of 1.1%–1.3% is steady, not exciting, and frequent equity issuance can keep per-share growth modest. If investors pay too much for the monthly-dividend brand, the bond-like duration becomes a liability.
What would break the case. Rent recapture below 100%, leverage climbing without faster per-share AFFO, or the data-center expansion introducing development risk that is not matched by returns.
VICI Properties (VICI): highest yield, deepest disagreement
Why it ranks here. The new $1.84 annual dividend implies a 7.2% yield at the cutoff price, the highest in this group. Q2 AFFO per share grew 4.6% to $0.62, and the post-quarter dividend consumes roughly 74% of that annualized run rate. At about 10.3 times 2026 AFFO guidance, the valuation already discounts bad news.
The variant view. Long master leases with contractual escalators can produce more durable rent than the share-price collapse suggests. The $1.16 billion Golden Entertainment transaction came with an initial 7.5% cap rate and a 30-year lease.
First rejection test. VICI is not a diversified consumer landlord in the same sense as O. Tenant and gaming exposure are concentrated, asset reuse can be difficult, and the share price fell 24.1% over the measured year before dividends. The Q2 GAAP decline was driven by a $413.1 million change in CECL allowance; AFFO removes that noise, but the credit judgment behind long-dated investments still matters.
What would break the case. Deteriorating tenant rent coverage, larger credit-loss provisions accompanied by weaker cash collections, or repeated acquisitions that raise leverage without per-share growth. VICI is the value candidate—not the sleep-easy substitute for a bond.
Digital Realty (DLR): the best AI-income blend
Why it ranks here. Q2 Core FFO excluding net promote rose 13.9% to $2.13 per share. The $1.22 dividend used 57.3% of that figure, and net debt to adjusted EBITDA was 4.7 times. Management raised 2026 Core FFO ex-promote guidance to $8.15–$8.20.
The variant view. DLR is not simply a proxy for server demand. Its record signed backlog and renewal pricing demonstrate an ability to monetize scarce power and interconnection. July’s two hyperscale leases represented $410 million of annualized GAAP base rent at 100% share.
First rejection test. At roughly 23 times guidance and a 2.6% yield, a buyer is paying for years of conversion from backlog into cash. The company issued approximately $2.5 billion of equity in the first half, and $4.25–$4.75 billion of net development capex guidance exposes investors to execution, power and timing risks.
What would break the case. Backlog delays, falling stabilized yields, power constraints that strand capital, or dilution that prevents Core FFO per share from keeping pace with asset growth.
W. P. Carey (WPC): a repaired payout, not a restored legacy
Why it ranks here. Q2 AFFO per share reached $1.34 and the $0.94 dividend used 70.1%. The 5.3% indicated yield and roughly 13.5-times guidance valuation are reasonable for a diversified net-lease portfolio. Management’s $5.19–$5.27 AFFO guide implies about 5.2% midpoint growth.
The variant view. The 2023 office exit and dividend reset remain anchored in investors’ memory. Today’s dividend should be judged against today’s AFFO, not the old payout. A low 3.2% weighted-average debt rate and substantial industrial exposure create a credible recovery base.
First rejection test. Reported leverage was 5.5 times before unsettled forward equity, higher than we prefer, and international exposure adds currency and financing complexity. A lower multiple is partly compensation for a strategy that already broke its dividend-growth record.
What would break the case. Leverage staying elevated, acquisition growth failing to reach AFFO per share, or another portfolio simplification that resets the payout.
STAG Industrial (STAG): good coverage, mixed operating signals
Why it ranks here. The quarterly dividend used just 59.6% of Q2 Core FFO. Core FFO per share grew 3.2%, same-store cash NOI rose 3.4%, and leases commenced in Q2 carried a strong 19.8% cash-rent increase.
The variant view. Secondary industrial markets can provide better acquisition yields and tenant diversification than trophy warehouses. STAG acquired seven fully occupied buildings at a 6.1% cash cap rate in Q2.
First rejection test. Total occupancy was 94.5% and Q2 renewal retention was 75.7%. Those figures are not disastrous, but they are weaker than the smooth “e-commerce warehouse” story. Also note the practical change: STAG moved from monthly to quarterly dividends in 2026, so older monthly-income lists are stale.
What would break the case. Occupancy slipping further, leasing costs rising faster than rent spreads, or acquisition growth masking weak existing assets.
Equinix (EQIX): elite platform, wrong high-yield category
Why it makes the list. Q2 AFFO per share grew 19% to $11.78, monthly recurring revenue rose 11%, and 9,700 net interconnections extended the network effect. The $5.16 dividend consumed only 43.8% of Q2 AFFO.
The variant view. Equinix may be the highest-quality operating platform here. Its interconnection density can turn physical data centers into an ecosystem rather than a commodity shell. Management expects 2027–2029 AFFO-per-share growth of 9%–12% annually.
First rejection test. The 2.0% indicated yield simply is not high. The stock finished the measured year 37.8% higher on an adjusted-close basis and trades around 24 times the midpoint of 2026 AFFO guidance. Q2 also benefited from one-time xScale fees, so the 19% growth rate should not be extrapolated mechanically.
What would break the case. Bookings slowing while $5–$7 billion annual capex persists, returns on new capacity falling, or valuation compressing even as operations remain healthy. This is an AI compounder watchlist name, not the answer to an immediate-income brief.
A rate-cycle stress test investors can actually use
“Rates down, REITs up” is too simple. Lower Treasury yields can help valuations and reduce future financing costs, but they often arrive alongside weaker growth. Higher yields can pressure multiples, yet a landlord acquiring assets at wider cap rates may improve future economics if its funding advantage survives.
Long-duration leases become more attractive relative to bonds. The catch is whether the cut signals tenant stress.
Forward equity and investment-grade tenants help, but acquisitions must still add AFFO per share.
Backlog converts only when energization, construction and customer deployment occur on schedule.
Contractual rent is valuable only while concentrated operators can comfortably pay it.
Our base-case preference is therefore a barbell: covered net-lease income on one side, a smaller digital-infrastructure growth sleeve on the other. We would not treat the two as substitutes. Investors tempted to reach further into double-digit payouts should compare the different credit risks in our BDC payout-durability review and run the warning signs in our safe high-yield framework.
What a Swiss investor actually receives
For a Swiss resident holding U.S. REIT shares, the broker statement and final tax position can differ. With valid treaty documentation, ordinary U.S. dividends are generally subject to a 15% U.S. withholding rate, but REIT distributions can include ordinary dividends, capital-gain distributions or return of capital, and special real-property rules may apply. The issuer’s year-end tax characterization—not this article—controls.
The same quick arithmetic gives roughly 4.51% for Realty Income and 3.75% for Agree Realty after assumed 15% U.S. withholding, before Swiss tax and currency effects. It is an illustration, not a tax forecast. Use our dividend withholding guide as a starting map and obtain advice for your residence, account and reclaim eligibility.
Investment conclusion
Three distinct jobs, three different answers
ADC has the cleaner combination of growth, occupancy and payout headroom.
O offers the more attractive yield and broader platform, with slower organic growth.
VICI’s 7.2% yield is compelling only if tenant concentration is deliberately accepted.
DLR has the better balance of backlog, payout capacity and current yield.
EQIX belongs on a growth watchlist; calling 2% “high yield” weakens the analysis.
What would change our order: ADC losing per-share growth after its equity funding; Realty Income’s data-center capital earning below target; VICI tenant coverage weakening; DLR backlog conversion slipping; or a valuation reset that makes EQIX’s growth available at a materially higher prospective return.
High-yield REIT questions, answered
What is the best high-yield REIT for 2026?
On our Q2 2026 durability framework, Agree Realty ranks first for dividend quality and Realty Income for the best scale-and-yield balance. VICI has the highest indicated yield, but its concentrated experiential tenant base requires a larger risk discount.
Which REITs pay monthly dividends?
Agree Realty and Realty Income pay monthly. STAG Industrial changed from monthly to quarterly payments in 2026, an easy detail to miss in older lists. Payment frequency does not improve economic coverage.
Why use AFFO payout ratio instead of EPS?
GAAP EPS includes scheduled real-estate depreciation and property-sale effects that can obscure recurring property operations. FFO adjusts those items; AFFO usually goes further by accounting for recurring capital needs and straight-line rent, although issuer definitions are not standardized.
Are data-center REITs a safe way to invest in AI?
No equity is “safe.” Digital Realty and Equinix have strong demand indicators, but both face power availability, construction, financing, customer concentration and valuation risks. Signed rent backlog and per-share cash-flow growth are more useful than AI labels.
Do lower interest rates always help REITs?
Lower long-term yields can support REIT valuations and reduce future borrowing costs. They can also coincide with weaker tenant demand. Lease quality, debt maturities, acquisition spreads and organic rent growth determine whether the benefit reaches shareholders.
How are U.S. REIT dividends taxed for Swiss investors?
Ordinary U.S. dividends paid to an eligible Swiss resident are generally subject to a 15% treaty withholding rate when documentation is correct. REIT capital-gain and nondividend distributions can be treated differently, so investors should use issuer tax notices and personal advice.
Portfolio-level rate risk: Before selecting an individual property company, see our 2026 dividend-duration stress test. It measures how listed real estate, utilities, BDCs and preferreds responded to changes in the 10-year Treasury yield.
Primary sources and calculation notes
- Agree Realty Q2 2026 results
- Realty Income Q2 2026 results and Cloud Capital data-center venture release
- VICI Q2 2026 results and 3 September dividend increase
- Digital Realty Q2 2026 results
- W. P. Carey Q2 2026 supplemental
- STAG Industrial Q2 2026 results
- Equinix Q2 2026 results
- Market prices, adjusted-close history and distributions: Yahoo Finance, 4 September 2025–4 September 2026. Adjusted close is a distribution-adjusted market-price proxy, before tax, fees and FX; it is not property NAV.
Original calculations by Top Dividend Stocks. Payout = Q2 regular dividend ÷ Q2 AFFO or stated Core FFO. Indicated yield = latest declared regular dividend annualized ÷ 4 September 2026 close. Valuation = price ÷ midpoint of 2026 issuer guidance where available, otherwise price ÷ Q2 metric annualized. Figures may not sum because of rounding.
Disclosure: This is independent research for education, not personalized investment, legal or tax advice. REIT prices, dividends, guidance and tax character can change. Past performance and company guidance do not guarantee future results. Verify current filings and consider your objectives, currency exposure and ability to bear loss.