A 23% dividend yield looks like an answer. In shipping, it is usually a question disguised as a percentage.
At the 28 August 2026 closing prices, the latest declared dividends from Okeanis Eco Tankers (NYSE: ECO), DHT Holdings (NYSE: DHT) and Star Bulk Carriers (Nasdaq: SBLK) annualize to 31.4%, 24.8% and 11.8%, respectively. An equal-weighted average is 22.7%—close enough to the 23% headline in the screen that inspired this analysis.
The arithmetic is not the problem. The time horizon is. That 22.7% figure multiplies one extraordinary quarter by four. Apply the same 28 August prices to all dividends attributable to 2025 and the basket yields only 4.0% on average. The difference is not accounting trivia. It is the investment thesis.
Our conclusion: ECO, DHT and SBLK are not three bond substitutes. They are three forms of freight-rate exposure that happen to settle part of each good quarter in cash.
The 23% yield exists only if one exceptional quarter repeats
Dividend yield at 28 August 2026 closing prices, measured three ways
The 23% average is a latest-quarter annualization. Observed cash distributions tell a much less spectacular — and more useful — story.
Sources: company dividend releases. Closing prices 28 August 2026: ECO $66.91, DHT $19.66, SBLK $30.48. Simple pre-tax yields.
Show the data
| Ticker | Latest quarter annualized | Trailing four quarters | FY2025 dividends |
|---|---|---|---|
| ECO | 31.4% | 14.3% | 5.0% |
| DHT | 24.8% | 12.5% | 5.0% |
| SBLK | 11.8% | 6.2% | 1.9% |
The 23% number is correct—and answers the wrong question
“Forward yield” often means the latest dividend multiplied by the expected payment frequency and divided by the share price. That convention is tolerable for a utility whose quarterly dividend inches upward once a year. It becomes dangerous when the dividend is explicitly linked to profits or cash flow in one of the world’s most cyclical industries.
A shipowner sells perishable capacity. A vessel day that departs without the best available cargo can never be inventoried and sold next month. When too few compliant ships chase urgent cargoes, charter rates can rise several times faster than operating costs. Almost every extra dollar above the vessel’s cash break-even drops toward earnings. The same operating leverage works in reverse when ton-mile demand falls or more ships become available.
That is why these dividends have surged. It is also why an income investor should not project them like rent from a long lease.
| Ticker | Latest quarterly dividend | Latest × 4 yield | Trailing 4-quarter yield | FY2025 yield at today’s price | Payout architecture |
|---|---|---|---|---|---|
| ECO | $5.25 | 31.4% | 14.3% | 5.0% | Board-discretionary, cash-flow-sensitive dividend |
| DHT | $1.22 | 24.8% | 12.5% | 5.0% | Targets 100% of ordinary net income |
| SBLK | $0.90 | 11.8% | 6.2% | 1.9% | May distribute 100% of defined cash flow; $0.05 intended quarterly minimum |
Prices: ECO $66.91, DHT $19.66 and SBLK $30.48 at the 28 August 2026 close. Yields are simple, pre-tax calculations. “FY2025” uses dividends related to Q1–Q4 2025, even when paid in 2026.
Three tickers, one hidden factor
ECO and DHT operate crude-oil tankers. SBLK transports dry-bulk cargoes such as iron ore, coal and grain. Those are different markets, but the shareholder experience shares the same mechanism:
- Freight rates rise while daily vessel costs move much more slowly.
- Operating cash flow expands disproportionately.
- A variable or formula-based payout sends much of that windfall to shareholders.
- The latest payment is annualized as if the freight shock were a permanent coupon.
The result is a portfolio that looks diversified by ticker but remains concentrated in one economic factor: the scarcity price of ship capacity. Two tanker companies add direct overlap. Star Bulk changes the cargo, not the dependence on charter markets.
This is the same analytical mistake that turns a fund’s distribution rate into a promised return. Our ultra-high-yield ETF forensic guide addresses a different structure, but the discipline is identical: trace the cash to its economic source before treating it as income.
Where the cash actually came from
ECO: the most explosive operating leverage
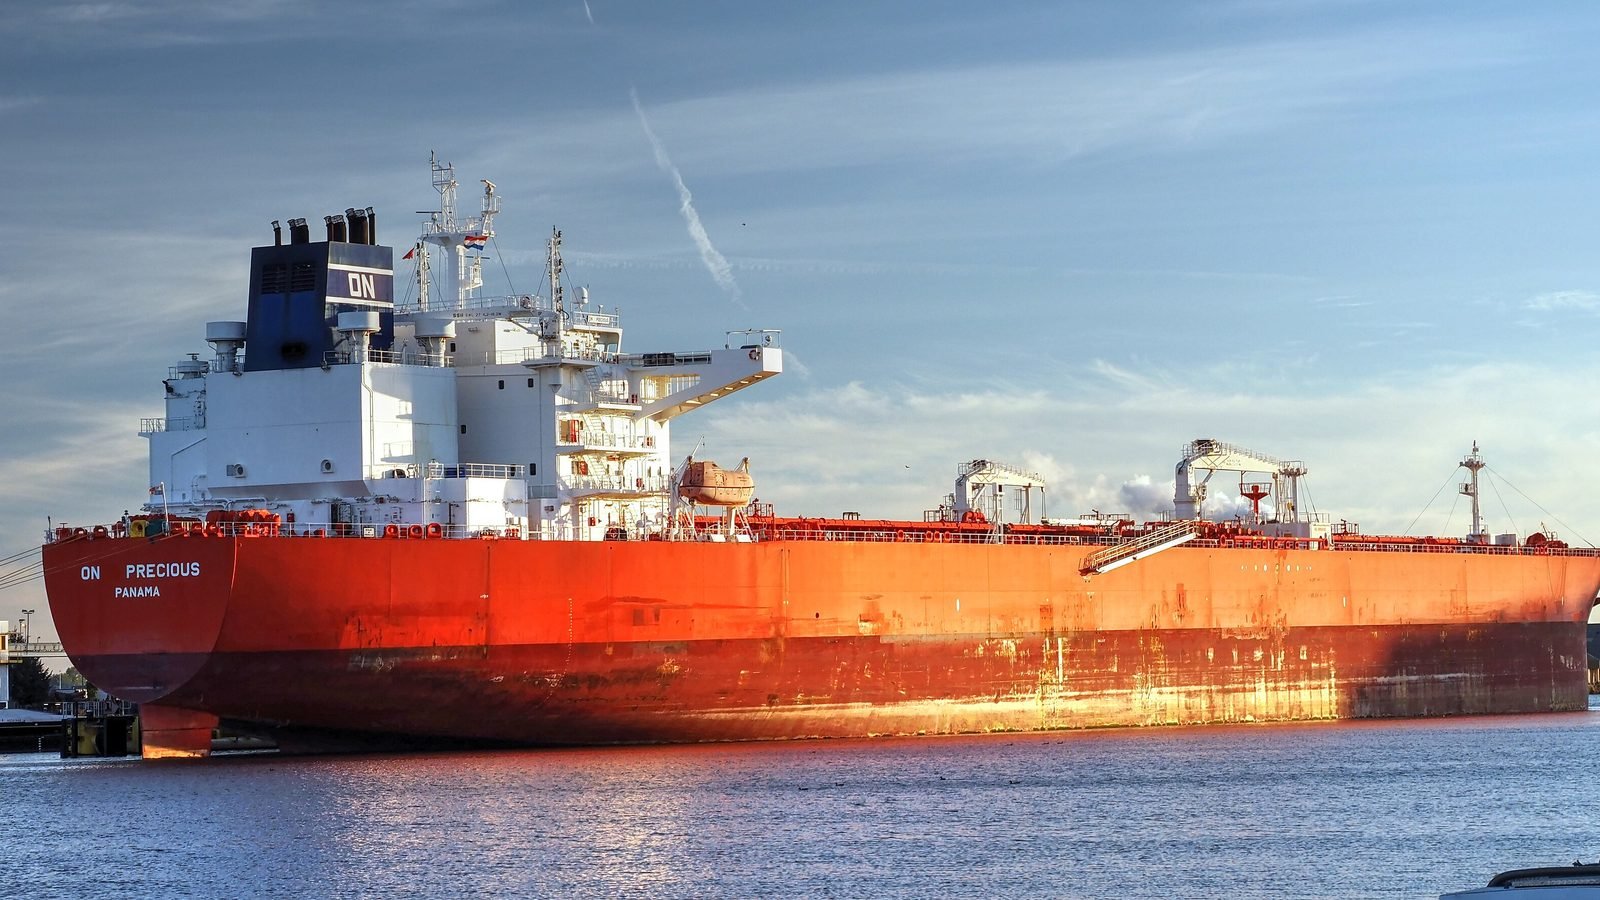
Okeanis Eco Tankers produced one of the clearest freight-windfall quarters an income investor will ever see. Its Q2 2026 fleetwide time-charter-equivalent rate reached $181,200 per operating day, versus $50,500 one year earlier. Daily operating expense, including management fees, was $9,936—almost unchanged from $9,963 in Q2 2025.
That is the entire story in two lines. Revenue per ship day more than tripled while the daily cost base barely moved. Adjusted earnings reached $5.91 per share, and the board declared $5.25. The payment was well covered by the quarter’s profit; it was not financial engineering.
But “covered this quarter” is not the same as “repeatable for four quarters.” ECO’s dividends related to the six quarters from Q1 2025 through Q2 2026 were $0.32, $0.70, $0.75, $1.55, $2.00 and $5.25. That sequence is an earnings seismograph.
The near-term bull case remains real. At the Q2 release, ECO had already booked 48% of available Q3 VLCC spot days at $206,600 and 42% of Suezmax days at $133,000. The company therefore offers the strongest immediate cash-flow momentum of the three. It also has the greatest risk that investors mistake a geopolitical freight premium for a permanent dividend regime.
DHT: the cleanest payout rule, not the steadiest payout
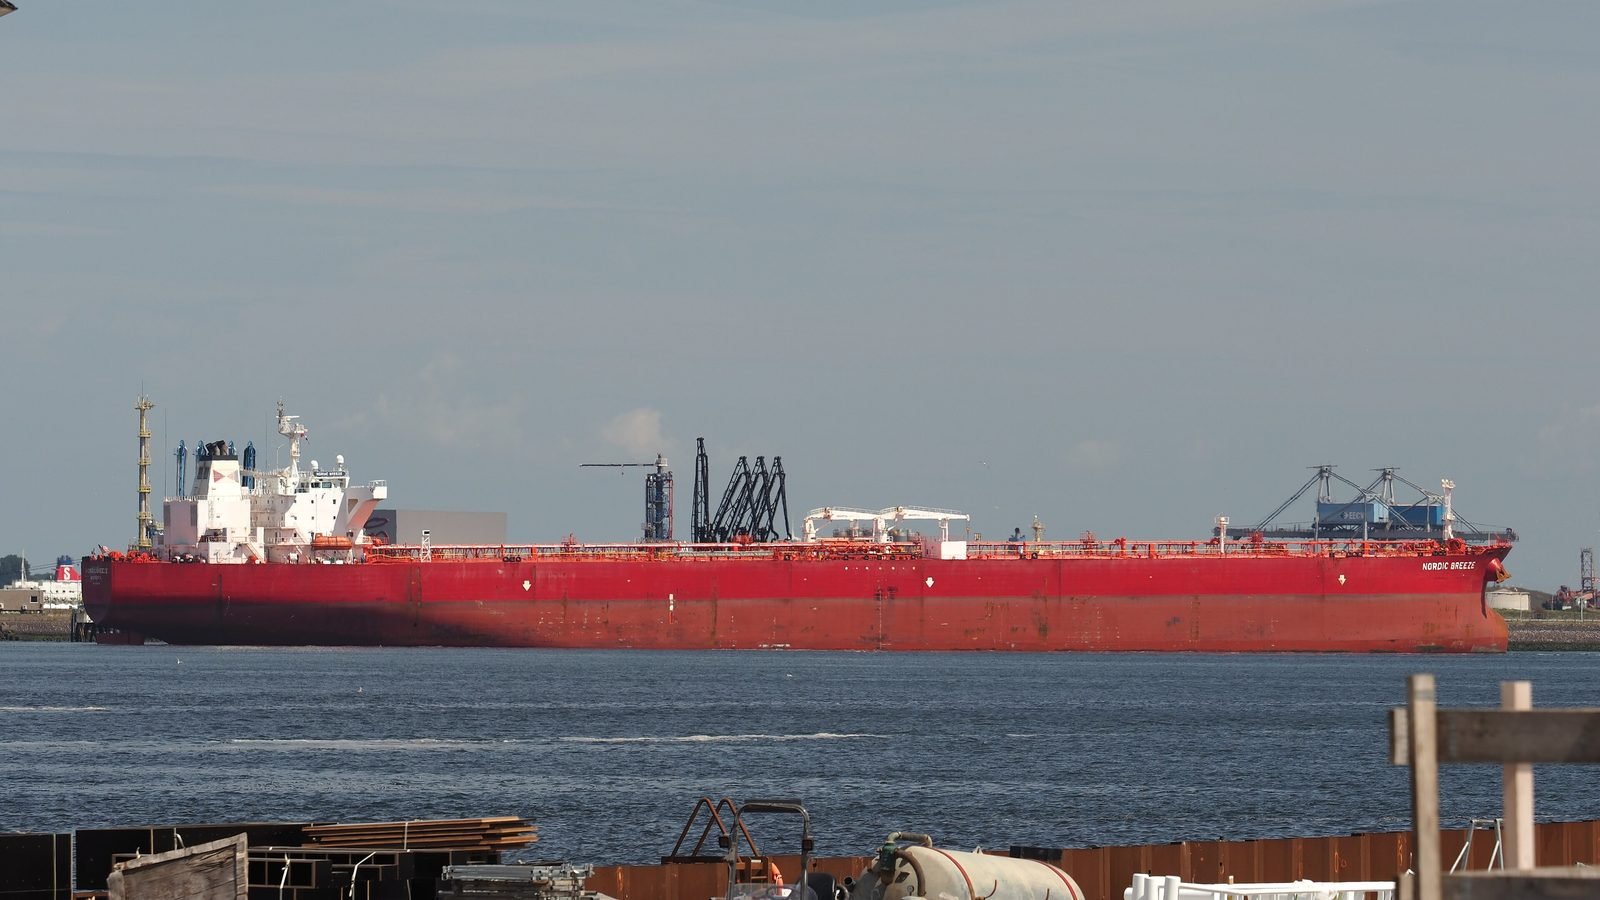
DHT’s dividend is unusually legible. The company targets 100% of ordinary net income, and its Q2 payment of $1.22 matched ordinary earnings of $1.22 per share. It was DHT’s 66th consecutive quarterly cash dividend.
“Consecutive” deserves respect; “stable” would be inaccurate. DHT’s quarterly dividends moved from $0.15 in Q1 2025 to $0.24, $0.18, $0.41, $0.64 and then $1.22. The formula did exactly what it promised: it transmitted the tanker cycle to shareholders.
The underlying quarter was exceptional. DHT’s Q2 2026 combined TCE was $126,700 per day. Spot VLCCs earned $162,600 per day, up from $48,700 in Q2 2025. Two ships were fixed for one year at an average $109,000 per day, and a later three-year charter was set at $75,000. Those contracts sacrifice some spot upside but give DHT more revenue visibility than a pure spot operator.
For an investor who accepts a floating payout, DHT has the most coherent income process here. It still does not have a 24.8% bond-like yield. It has a transparent mechanism for paying out whatever the tanker market earns.
SBLK: a different cargo cycle and a small floor
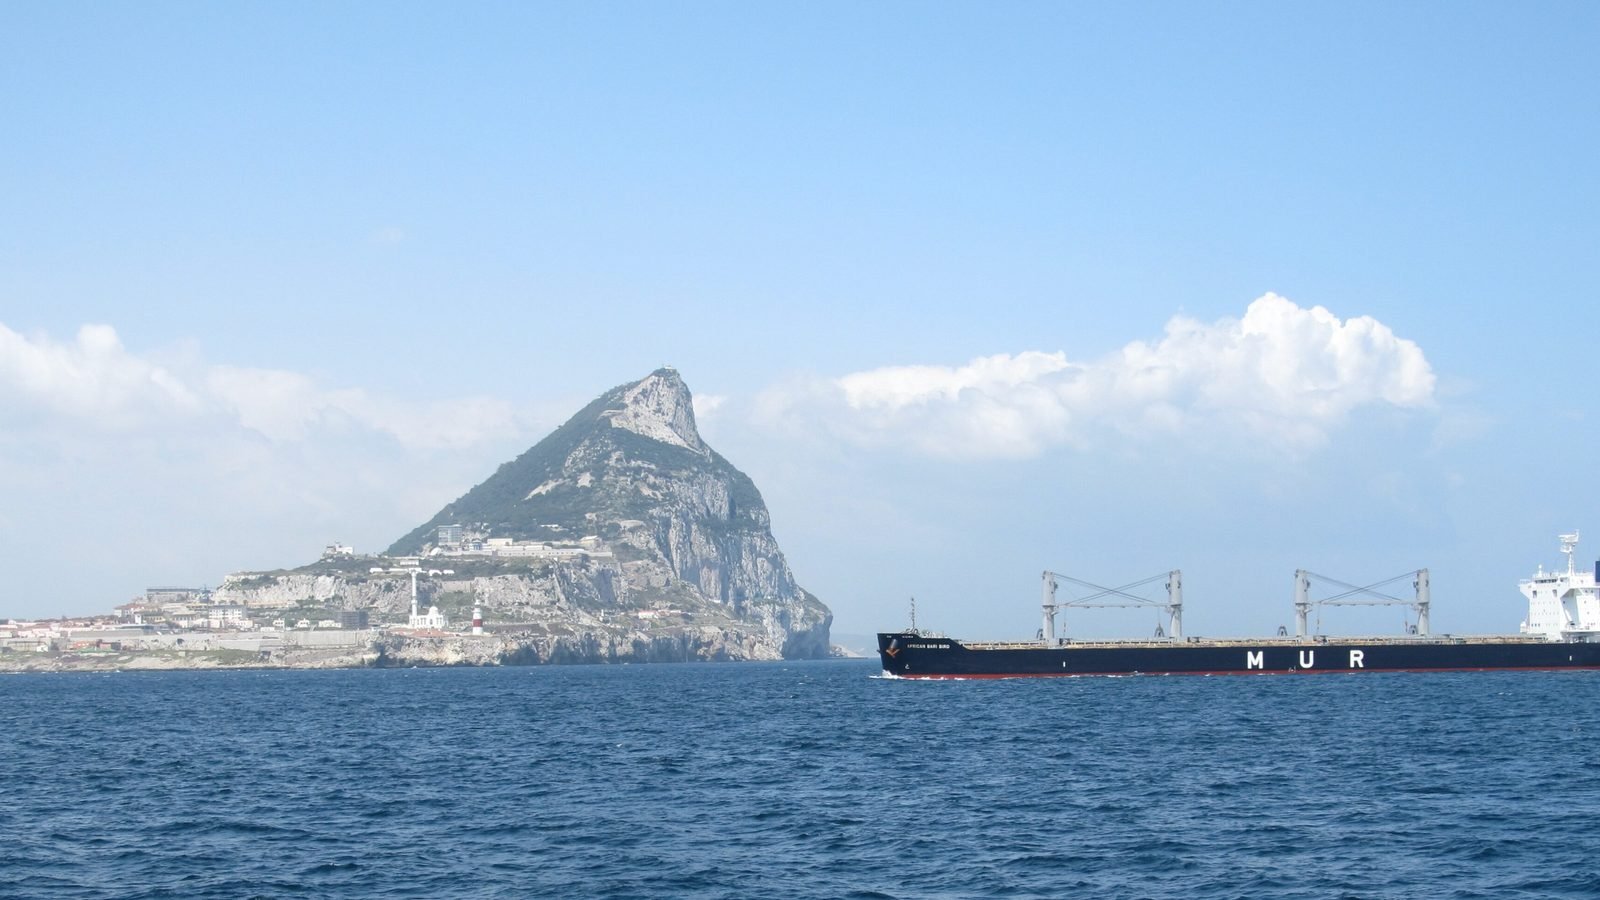
Star Bulk is not a tanker company. Its 138-vessel fully delivered fleet spans Newcastlemax, Capesize, Kamsarmax, Ultramax and Supramax dry-bulk ships. That reduces direct oil-tanker overlap, but it introduces exposure to steel production, power demand, grain flows, Chinese imports and global industrial activity.
Q2 2026 TCE increased to $24,486 per vessel per day from $13,624 a year earlier. Net income reached $1.30 per share and the board declared $0.90. Management described the payment as the full operating cash flow remaining after capital expenditure and debt service.
Star Bulk also intends to pay a minimum $0.05 each quarter even when its cash-flow calculation would imply less or nothing. At the 28 August price, that $0.20 annualized minimum represents only about 0.7%. It is a useful signal of capital-allocation intent, not support for the 11.8% headline yield—and the board retains discretion.
These dividends accelerated 8× to 18× in six quarters
Quarterly dividend per share indexed to Q1 2025 = 100; low starting payouts amplify the percentage change
All three payouts accelerated dramatically. That confirms the strength of the current shipping cycle, and it shows why the latest quarter should not be treated as a fixed run rate.
Sources: ECO, DHT and Star Bulk dividend disclosures, shown by related quarter. Indexing illustrates volatility, not expected growth.
Show the data
| Quarter | ECO | DHT | SBLK |
|---|---|---|---|
| Q1 2025 | $0.32 | $0.15 | $0.05 |
| Q2 2025 | $0.70 | $0.24 | $0.06 |
| Q3 2025 | $0.75 | $0.18 | $0.12 |
| Q4 2025 | $1.55 | $0.41 | $0.38 |
| Q1 2026 | $2.00 | $0.64 | $0.51 |
| Q2 2026 | $5.25 | $1.22 | $0.90 |
The most important chart is the dividend path, not the yield snapshot
From Q1 2025 to Q2 2026, the quarterly dividend grew 16.4 times at ECO, 8.1 times at DHT and 18 times at SBLK. Low starting payments exaggerate the multiples, but that is precisely the warning. A statistic that can rise 18-fold in six quarters can also fall much faster than a conventional income investor expects.
Nearly half of each company’s trailing-four-quarter dividend came from Q2 2026 alone: approximately 55% at ECO, 50% at DHT and 48% at SBLK. A single quarter is doing extraordinary work in the trailing data as well as the annualized figure.
Half of the trailing dividend arrived in a single quarter
Share of the trailing four-quarter dividend per share contributed by Q2 2026
Q2 2026 supplied roughly half of the trailing cash at each company. That concentration is the clearest warning against extrapolating one quarter indefinitely.
Sources: ECO, DHT and Star Bulk dividend disclosures. Trailing four quarters = Q3 2025 through Q2 2026, by related quarter.
Show the data
| Ticker | Q2 2026 share | Previous three quarters | Trailing four quarters |
|---|---|---|---|
| ECO | 55% | 45% | $9.55 |
| DHT | 50% | 50% | $2.45 |
| SBLK | 48% | 52% | $1.89 |
This does not make the shares bad investments. It changes how they should be underwritten. A buyer should demand an expected total return that compensates for declining dividends in a normal freight market—not merely ask whether the next payment is covered.
A better valuation framework for variable shipping dividends
We would separate the investment into four ledgers.
1. Through-cycle cash income
Use a full-cycle or deliberately conservative dividend, not the latest quarter. At today’s prices, dividends related to 2025 imply roughly 5.0% for ECO, 5.0% for DHT and 1.9% for SBLK. Those are not forecasts, but they are a more sober starting point than 31%, 25% and 12%.
2. Windfall distributions
Treat the difference between a normal-cycle payout and the current payout as a special dividend. Spend it, reinvest it or hold it as dry powder—but do not build essential living expenses around it. Our living-off-dividends framework is designed around precisely this distinction between dependable and opportunistic cash flow.
3. Vessel net asset value
A shipowner is not just an earnings stream. It owns steel that can be sold, financed or scrapped. Compare enterprise value with the market value of the fleet after net debt. A seemingly cheap P/E at peak freight rates can coexist with a premium to vessel NAV; a low-cycle loss can coexist with discounted hard assets.
4. Freight-rate duration
Ask how much of next quarter is already booked, how much exposure remains in the spot market and whether new time charters lock in attractive economics. ECO currently provides the most explosive spot-linked upside. DHT mixes spot exposure with meaningful high-rate term coverage. Star Bulk spreads risk across more ships and dry-bulk classes, but remains exposed to global trade volumes.
Bull, base and bear cases
| Scenario | What happens | Dividend implication | Evidence to monitor |
|---|---|---|---|
| Bull | Middle East rerouting and risk premiums persist; compliant tanker supply stays tight; dry-bulk demand remains firm. | ECO and DHT sustain unusually high payouts for several more quarters; SBLK remains well above its minimum. | Booked TCE rates, ton-mile demand, vessel availability, dry-bulk forward rates. |
| Base | Freight remains profitable but retreats from Q2 records as urgency and congestion ease. | Cash payouts fall below latest-quarter annualizations and settle closer to trailing or through-cycle levels. | Q3/Q4 fixtures, time-charter renewals, operating cash flow after capex and debt service. |
| Bear | Trade routes normalize, risk premiums disappear, cargo demand weakens or effective vessel supply rises. | Variable dividends compress sharply; a falling share price may keep the displayed yield high while wealth declines. | Spot-rate reversals, orderbook deliveries, scrapping, China demand, leverage and vessel values. |
Which stock has the strongest income architecture?
DHT is the most legible. Paying 100% of ordinary net income creates a clean link between earnings and the dividend. Its term charters add partial visibility, and 66 consecutive quarters demonstrate commitment. Investors must still accept a payment that moves with earnings.
ECO has the strongest current operating momentum. Its modern fleet, extraordinary Q2 economics and strong early Q3 fixtures make the near-term cash case compelling. It is also the easiest one to over-annualize because $5.25 followed $2.00, $1.55 and $0.75—not four prior payments near $5.
SBLK provides the broadest fleet and the only stated minimum. The $0.05 quarterly intention helps, but it supports less than 1% at the current price. The investment case rests on efficient operations, fleet value and dry-bulk cash generation—not the permanence of a $0.90 payment.
None should be compared directly with the 10-year U.S. Treasury’s roughly 4.7% yield without adjusting for risk. A Treasury held to maturity has defined coupons and principal repayment by the U.S. government. These equities offer higher potential cash returns, price upside and inflation sensitivity—but no fixed coupon, no maturity value and no protection from a freight downturn.
Our decision rule
Buy a variable-payout shipowner only if the thesis still works after replacing the latest dividend with a normal-cycle payment.
- If you need stable quarterly income, the current 23% basket is unsuitable as a core allocation.
- If you understand freight cycles, monitor vessel NAV and can reinvest windfall distributions, the shares can be attractive tactical income positions.
- If the investment case depends on receiving the Q2 2026 dividend four more times, you do not have an investment case. You have an extrapolation.
The 23% number is real in the narrowest mathematical sense. The more useful number is the 4% yield generated by dividends attributable to 2025 at today’s prices. Between those figures sits the value of the current freight shock—and the risk an investor is actually buying.
Frequently asked questions
Do ECO, DHT and SBLK really yield 23%?
The latest quarterly dividends annualize to an equal-weighted average of about 22.7% at 28 August 2026 prices. That is not a contractual forward payment. It assumes the latest dividend repeats for four consecutive quarters.
Which of the three has the safest dividend?
None offers a conventional stable dividend. DHT has the clearest formula and a long record of quarterly payments. Star Bulk states an intended $0.05 quarterly minimum, subject to board discretion. ECO’s dividend is highly responsive to cash generation and current tanker rates.
Are high shipping dividends automatically dividend traps?
No. All three latest payments were supported by strong quarterly economics. The trap is treating a cyclical, variable distribution as a permanent yield. Review total return, fleet value, leverage and freight-rate exposure alongside the payout.
What should investors monitor next?
Track booked TCE rates, spot exposure, new time charters, operating cash flow after capex, net debt, vessel values and the global orderbook. For a broader checklist, see our guide to spotting safer high-yield stocks.
Sources and methodology
- Okeanis Eco Tankers Q2 2026 results and Q2 dividend notice.
- DHT Holdings Q2 2026 results and company dividend history.
- Star Bulk Q2 2026 results and company dividend policy and history.
- Federal Reserve H.15 selected interest rates for the 10-year Treasury comparison.
- Closing prices on 28 August 2026: ECO $66.91, DHT $19.66 and SBLK $30.48. Market prices are snapshots and should be verified before investment decisions.
Research is educational and does not constitute personalized investment, legal or tax advice. Shipping rates, share prices and dividend declarations can change rapidly. Verify current company filings and your tax treatment before investing.