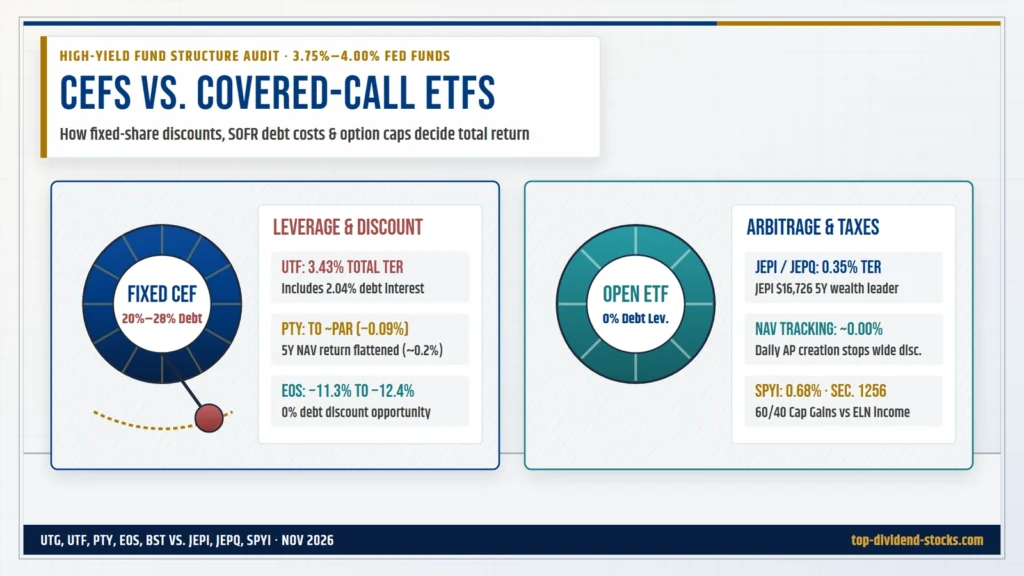
For years, income investors treated monthly 7% to 12% option-income ETFs like JEPI and JEPQ as the newest challengers to traditional Closed-End Funds (CEFs). By late 2026, the price tape reveals something far more instructive: PIMCO Corporate & Income Opportunity Fund (PTY)—long famous for trading at steep double-digit premiums to its Net Asset Value—has compressed right down to roughly par ($10.69 market price vs. $10.70 NAV, a −0.09% discount), while Eaton Vance Enhanced Equity Income Fund II (EOS) trades at an unusually deep −11.3% to −12.4% discount to NAV.
Meanwhile, interest rates explain why CEFs behave so differently from open-end covered-call ETFs. With the Federal Funds effective rate holding near 3.75%–4.00% in November 2026—down from 5.33% at year-end 2023, yet still miles above 2021’s 0.08% zero-rate floor—leveraged funds face persistent borrowing costs. Take Cohen & Steers Infrastructure Fund (UTF): alongside a 1.19% management fee, its 28.22% structural leverage introduces 2.04% in annual interest expense, pushing UTF’s total expense ratio to 3.43%—nearly ten times the 0.35% fee on unleveraged JPMorgan covered-call ETFs.
Deciding between closed-end funds vs. covered-call ETFs therefore has little to do with picking whichever monthly yield looks biggest on a screener. It hinges on three structural forces: fixed-share discount/premium swings around NAV, floating leverage borrowing drag versus option-upside caps, and tax character across U.S. and European accounts.
Executive Summary: CEFs vs. Covered-Call ETFs (November 2026)
- Plumbing determines price stability: Open-end ETFs (JEPI, JEPQ, SPYI) create and redeem shares daily to stay within ~0.04% of NAV. Closed-end funds (UTG, UTF, PTY, EOS, BST) trade on fixed share counts, creating discount tailwinds and premium crash risks.
- Leverage magnifies both drawdowns and expense drag: During 2022’s rate shock (EFFR 0.08% to 4.33%), leveraged CEFs UTG, UTF, and PTY fell −13.4% to −18.7% while unleveraged JEPI dipped just −3.49%. By Nov 2026, $10,000 invested in 2021 grew to $16,726 in JEPI vs. $16,135 in UTG, $13,763 in UTF, and $12,932 in PTY.
- Borrowing interest inflates total expense ratios: UTF’s 3.43% TER (2.04% interest) and UTG’s 2.09% TER (~1.21% interest) create steep hurdle rates, whereas option-overlay CEFs EOS (1.09% TER, 0% debt) and ETFs JEPI/JEPQ (0.35%) carry zero borrowing cost.
- Tax character favors equity option funds over ELNs in U.S. taxable accounts: NEOS SPYI (Section 1256 index options / ROC) and Eaton Vance EOS (qualified dividends + capital gains) often beat JEPI’s ordinary-income ELNs on U.S. after-tax retention.
Structural Plumbing: Fixed-Share Discounts vs. Open-End NAV Arbitrage
To understand why CEFs swing violently while covered-call ETFs track their underlying holdings calmly, start with how shares enter and leave the market. An exchange-traded fund such as JEPI, JEPQ, or SPYI uses an open-end creation/redemption mechanism: whenever retail buyers bid JEPI above its Net Asset Value, Authorized Participants step in, deliver the underlying equity basket, and mint fresh ETF shares—collapsing any premium within seconds. As of November 2026, JEPI trades effectively at 0.00% premium/discount and JEPQ hovers around −0.04%.
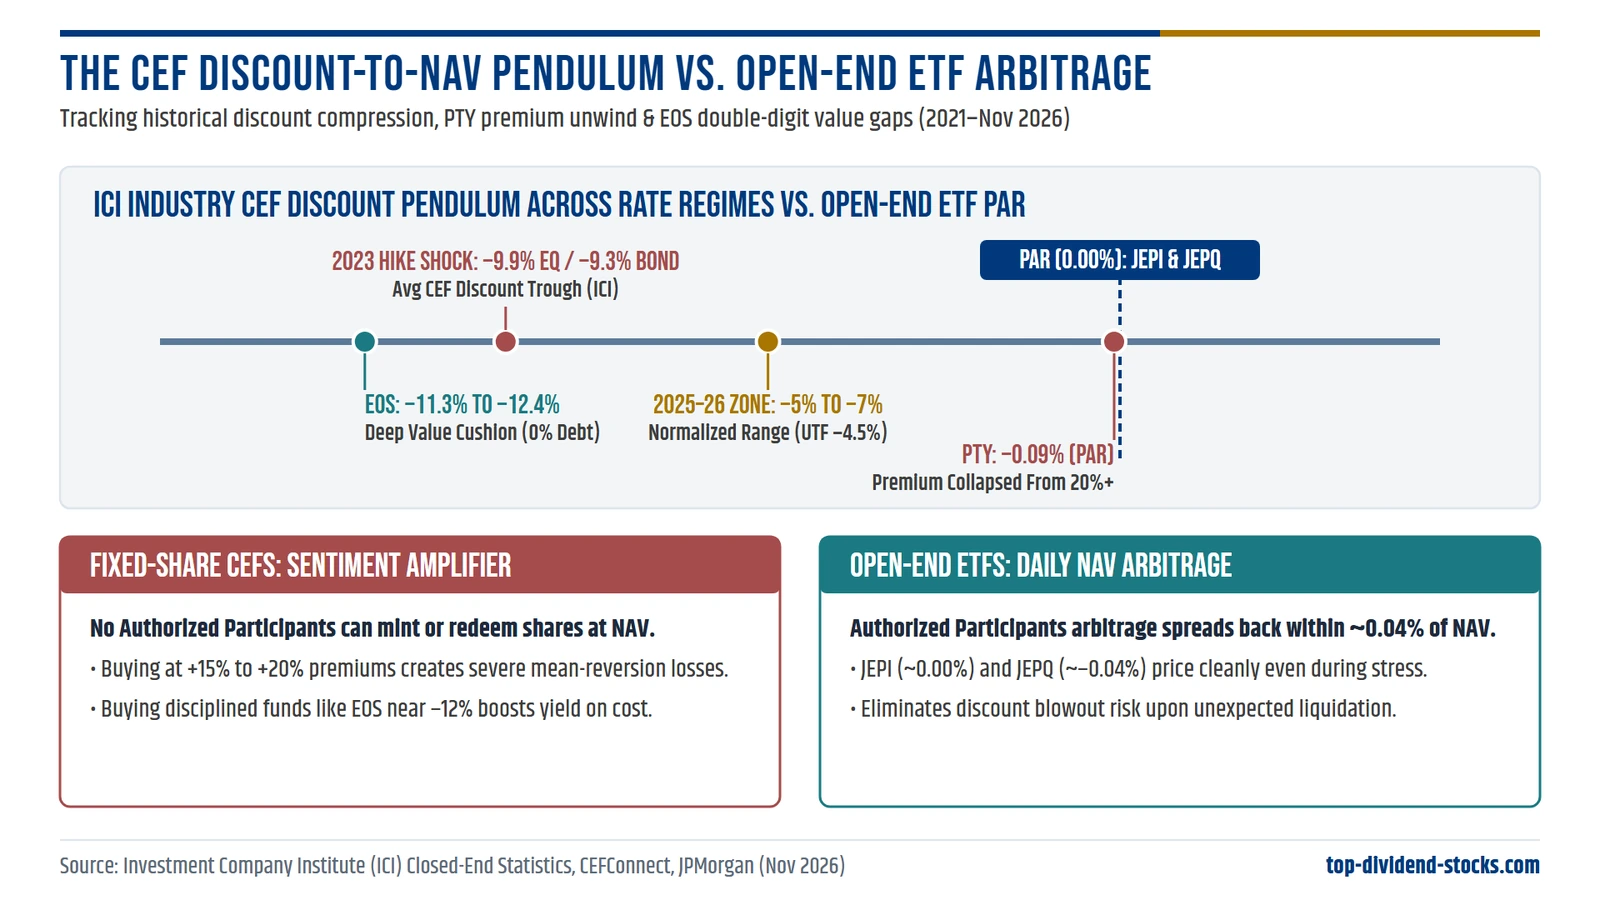
A traditional Closed-End Fund operates with a fixed share pool set at launch. No Authorized Participant can mint or redeem shares on demand. Consequently, secondary market buyers and sellers set the price, producing persistent gaps between Market Price and NAV. Investment Company Institute (ICI) data shows how wide that pendulum swings across macro regimes: at year-end 2021, equity CEFs averaged a −5.5% discount and bond CEFs sat near −0.5%; by year-end 2023 after rapid Fed tightening, average equity discounts blew out to −9.9% and bond CEFs dropped to −9.3%, before compressing back toward −7.0% (equity) and −5.2% (bond) in late 2024 and settling in the −5% to −7% zone across 2025–2026.
That fixed-supply quirk cuts both ways. Buying a disciplined option-income CEF like EOS at an −11.3% to −12.4% discount lets an investor purchase roughly $1.00 of large-cap U.S. growth equities for $0.88–$0.89—lifting effective cash yield on market price and offering capital-gain potential if the discount narrows back toward its historical average. Conversely, investors who bought PTY at 20%+ premiums in earlier zero-rate cycles suffered severe price losses even when underlying credit NAV held steady. That exact dynamic parallels the warning we raised in our analysis of NAV erosion and high-yield ETF traps: price return divorced from underlying NAV always eventually mean-reverts.
The 2021–2026 Rate Stress Test: Cumulative Wealth Under Leverage vs. Option Caps
Covered-call ETFs pay a well-known structural price: by selling out-of-the-money call options (or Equity-Linked Notes inside JEPI and JEPQ), they trade upside participation in roaring bull rallies for steady monthly option premium—a trade-off detailed across our JEPI vs. QYLD breakdown and weekly 0DTE ETF analysis. Yet across a full tightening-and-plateau rate cycle from 2021 through November 2026, limiting downside via unleveraged portfolios proved far more powerful than many investors assumed.
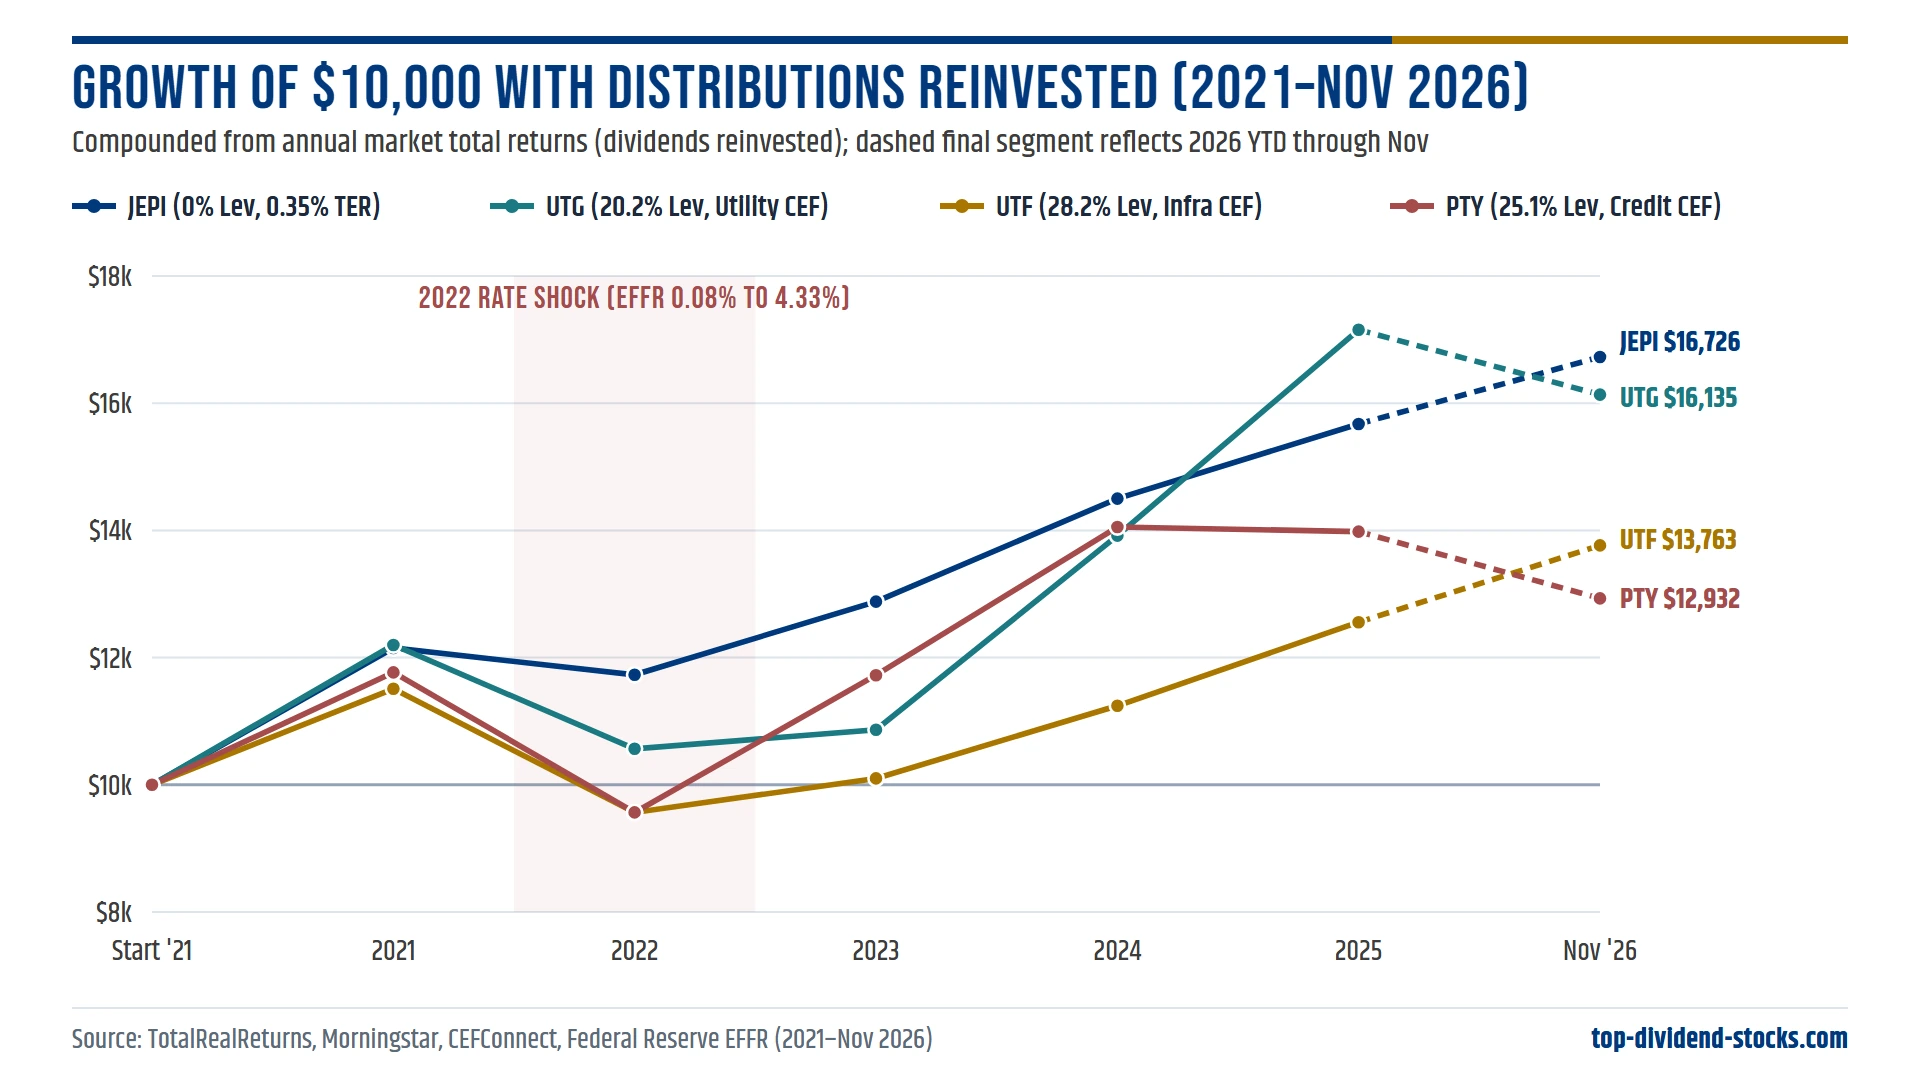
Look closely at Figure 2. In 2021, easy liquidity lifted all four funds roughly +15% to +22%. When the Federal Reserve hiked EFFR from 0.08% to 4.33% in 2022, leveraged CEFs absorbed forced collateral amplification: UTG fell −13.38%, UTF dropped −16.9%, and PTY plunged −18.71%, whereas unleveraged JEPI dipped only −3.49% cushioned by elevated option volatility premiums. Although UTG staged impressive rebounds in 2024 (+28.10%) and 2025 (+23.24%), 2026 YTD rate jitters pushed UTG (−5.94%) and PTY (−7.51%) back into negative territory while JEPI (+6.72%) crept steadily ahead.
Compounded from start of 2021 through November 2026, a hypothetical $10,000 reinvestment track ended at $16,726 in JEPI, ahead of UTG ($16,135), UTF ($13,763), and PTY ($12,932). Even more revealing, PTY’s 5-year annualized total return on underlying NAV flattened to roughly 0.2%—meaning almost the entire 13% annual distribution stream merely recycled capital and leverage carry during a multi-year bond bear market rather than compounding net asset value.
Expense Ratio Anatomy: Why 2% Borrowing Costs Change the Hurdle Rate
One of the biggest traps when comparing CEFs and ETFs on retail financial sites is reading headline fee tables without decomposing leverage interest expense. Under SEC reporting rules, a leveraged CEF must combine its advisory fee with interest paid on bank credit lines, reverse repurchase agreements, or preferred shares inside its Total Expense Ratio (TER).
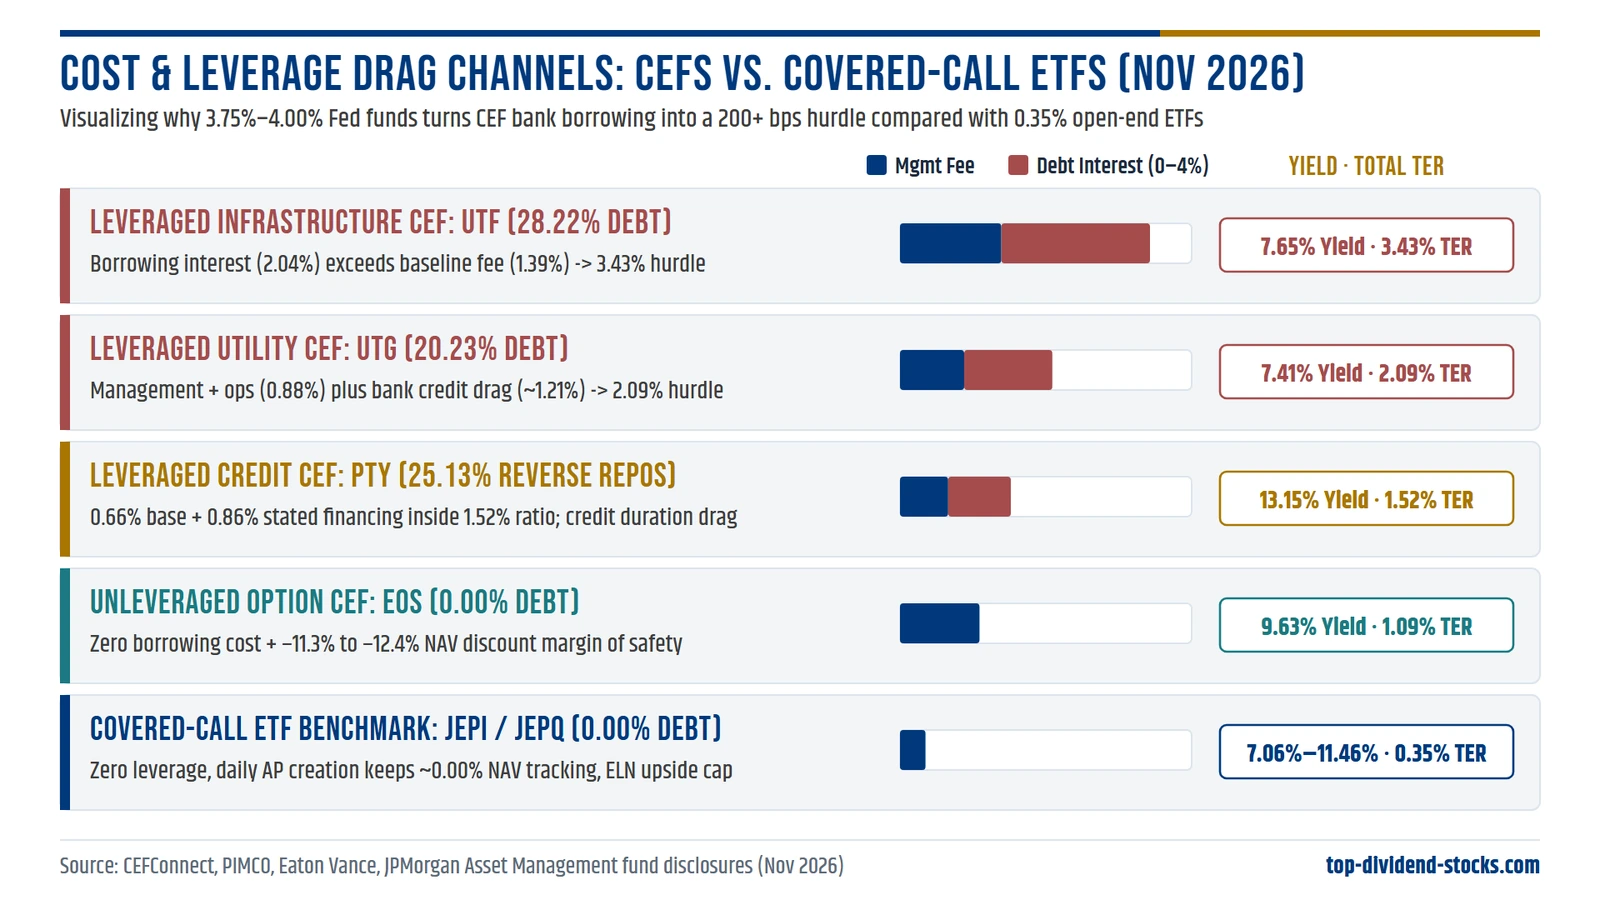
When short-term funding rates sat near 0.25% in 2021, borrowing 25%–30% of fund assets to buy 5%–7% utility stocks or 8% corporate bonds produced effortless positive carry. In late 2026, with benchmark rates near 3.75%–4.00% and SOFR-linked institutional credit facilities pricing around 4.5%–5.0%+, that leverage spread narrows sharply—especially for regulated infrastructure and utility equities yielding 3%–4%.
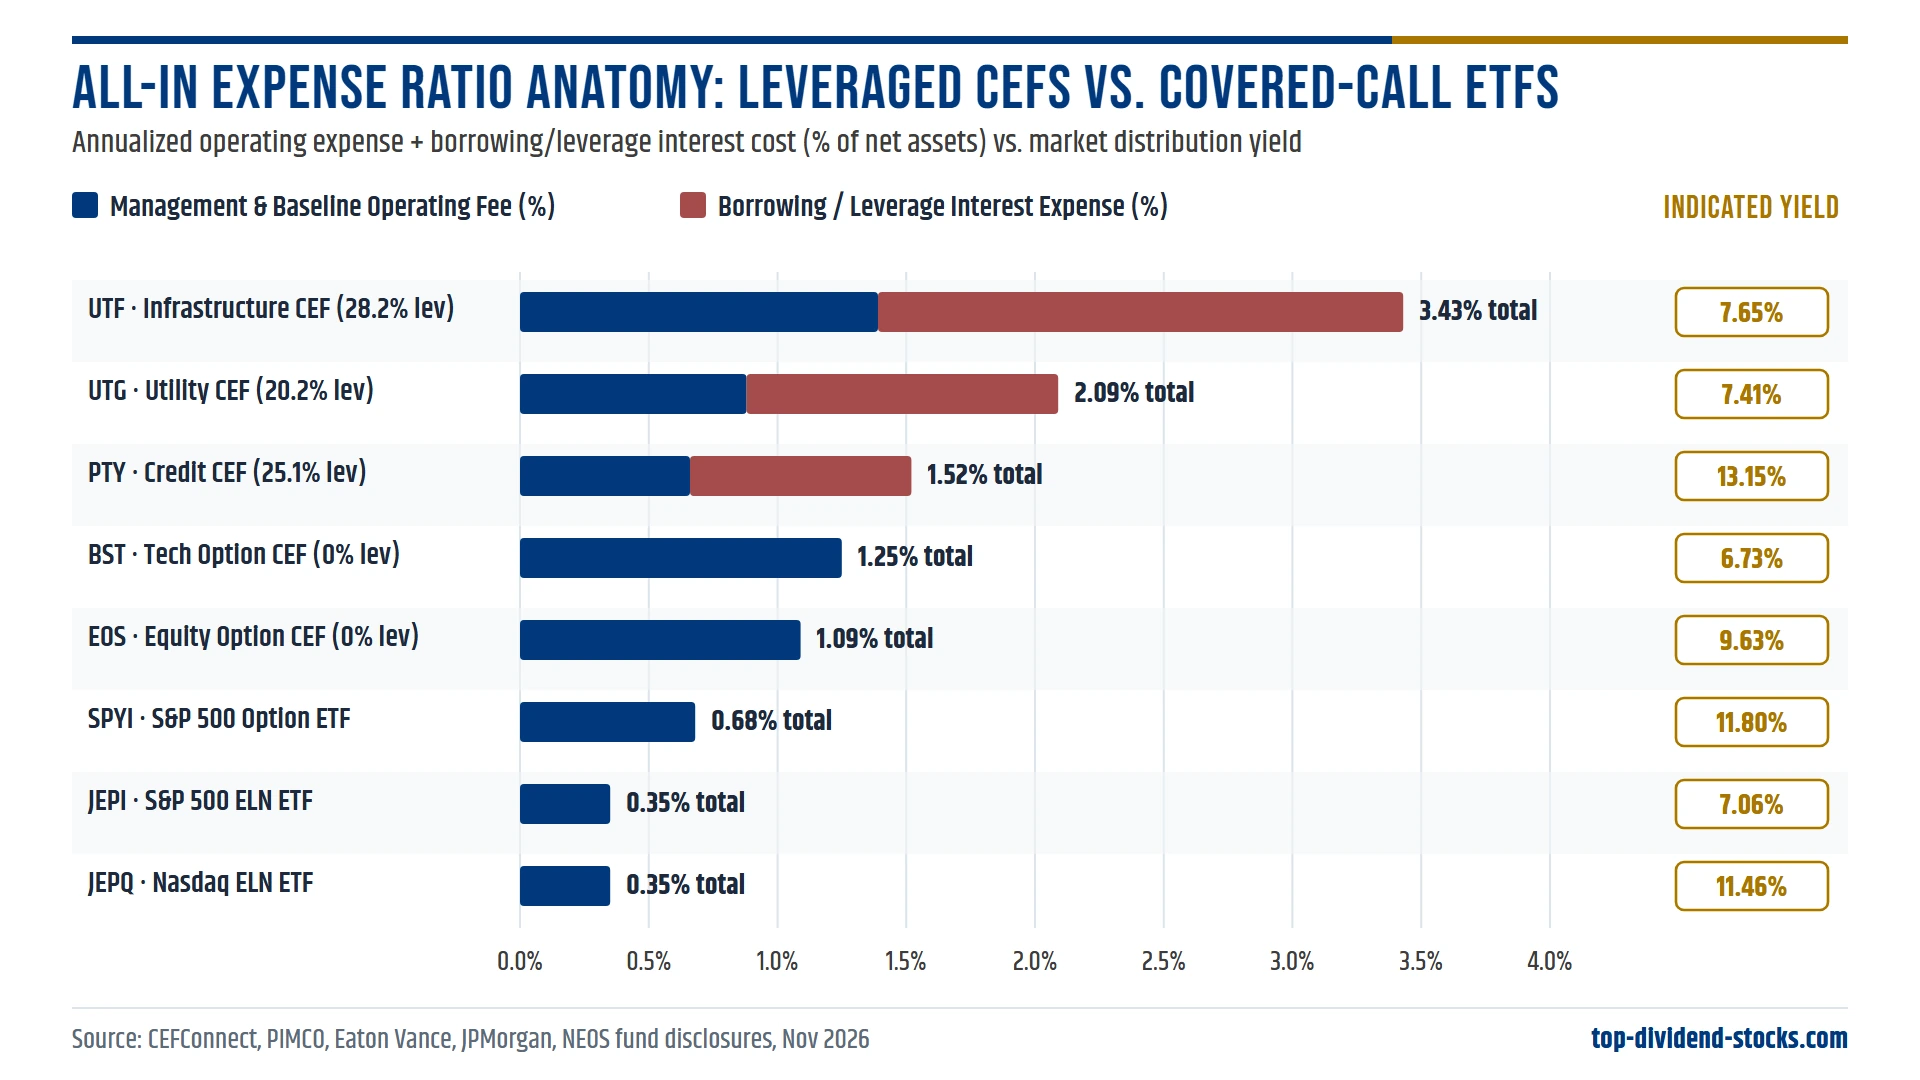
Figure 4 exposes the cost gap starkly. UTF carries 28.22% leverage and incurs a 2.04% interest expense on top of its 1.19% management fee and operating costs for a 3.43% total annual expense drag. UTG carries 20.23% leverage and roughly 1.21% interest cost inside a ~2.09%–2.23% TER. Compare those hurdles against unleveraged option CEFs like EOS (1.09% TER, 0% interest) or JEPI and JEPQ (0.35% TER). Every year, UTF’s portfolio managers must outperform JEPI’s portfolio by over 300 basis points just to match JEPI net of fees and borrowing costs—a feat achieved during utility/infrastructure tailwinds in 2024–2025 (+15.7% 3-year NAV annualized), but vulnerable whenever long bond yields push above 5%.
Asset Class vs. Borrowing Cost: Why Credit and Utilities React Differently
Notice that identical 25%–28% leverage hits bond CEFs and equity utility CEFs through completely different mechanics. Inside an infrastructure equity fund like UTF, underlying dividend yields on regulated pipelines, toll roads, and electric grids often average 3.5%–4.8%; when floating institutional credit facilities cost 4.5%–5.0%+, cash income carry on the leveraged sleeve shrinks toward zero or turns mildly negative, leaving fund total return dependent on capital appreciation or discount narrowing. By contrast, a multi-sector credit fund like PTY finances corporate and mortgage credit yielding 7%–10% against shorter-term reverse repurchase agreements (resulting in 0.86% net stated interest drag inside its 1.52% total ratio on reported structures), preserving positive coupon spread—yet remains acutely exposed to duration losses and credit spread widening if corporate defaults climb.
Unleveraged covered-call ETFs sidestep both bank borrowing spreads and forced collateral deleveraging. Because JEPI, JEPQ, and SPYI carry 0.00% debt leverage, their cost of generating extra distribution income comes purely from capping right-tail equity appreciation above short-term out-of-the-money call strikes. In flat, choppy, or gently rising rate markets like 2022–2026, monetization of implied equity volatility regularly beat borrowed leverage carry on risk-adjusted wealth.
Eight Flagship CEFs and Covered-Call ETFs Audited Side by Side
The comparison table below benchmarks five widely held CEFs across utilities, infrastructure, credit, and option-overlay equities against three benchmark covered-call ETFs—capturing November 2026 market discounts/premiums, leverage, fee drag, yields, and 3-year/5-year annualized NAV total returns.
| Ticker | Structure / Focus | Price / Discount to NAV | Indicated Yield | Leverage % | Total Expense (Interest) | 3Y / 5Y Ann. NAV Return |
|---|---|---|---|---|---|---|
| UTG | CEF · Utilities / Telecom | ~$34.01 (−2.9% disc.) | ~7.41% | 20.23% | ~2.09% (~1.21% int.) | ~16%–20% / ~7%–9% |
| UTF | CEF · Global Infrastructure | ~$25.75 (−4.5% disc.) | ~7.65% | 28.22% | 3.43% (2.04% int.) | ~15.7% / ~8.2% |
| PTY | CEF · Multi-Sector Credit | ~$10.69 (~−0.1% par) | ~13.15% | 25.13% | 1.52% (0.86% lev.) | ~4.1% / ~0.2% |
| EOS | CEF · Large Growth Options | ~$20.09 (−11.3% to −12.4%) | ~9.63% | 0.00% | 1.09% (0.00% int.) | ~13.8% / ~4.7% |
| BST | CEF · Science & Tech Opt. | ~$44.59 (−0.9% disc.) | ~6.73% | ~0.00% | ~1.25% (min.) | Tech-beta linked |
| JEPI | ETF · Defensive S&P + ELNs | ~$57.19 (0.00% NAV) | ~7.06% (SEC) | 0.00% | 0.35% (N/A) | ~10.7% / ~7.5% |
| JEPQ | ETF · Nasdaq-100 + ELNs | ~$56.19 (−0.04% NAV) | ~11.46% (SEC) | 0.00% | 0.35% (N/A) | ~17.1% / N/A (<5y) |
| SPYI | ETF · S&P 500 Tax-Opt. | ~$52.48 (~+0.04% NAV) | ~11.80% | 0.00% | 0.68% (N/A) | ~17.4% / N/A (<5y) |
Tax Character and Cross-Border Friction: The Overlooked Decider
Even after factoring in fees and discounts, tax treatment separates these vehicles sharply depending on your account wrapper and country of residence.
U.S. Taxable Investors: Ordinary ELNs vs. Section 1256 and Long-Term Capital Gains
Because JEPI and JEPQ generate option income via Equity-Linked Notes (ELNs), the bulk of their high monthly payout is taxed in U.S. taxable brokerage accounts at ordinary federal income tax rates (up to 37% marginal plus NIIT), making them far better suited to IRAs or Roth accounts as noted in our SCHD vs. JEPI comparison. By contrast, SPYI uses exchange-traded S&P 500 index call spreads qualifying for Section 1256 60% long-term / 40% short-term capital gains treatment and tactical Return of Capital (ROC) tax deferral, while equity-option CEFs like EOS and UTG frequently distribute substantial portions as qualified dividends or long-term capital gains—preserving dramatically more after-tax yield in taxable U.S. accounts.
Run a quick illustration on a $100,000 taxable U.S. brokerage stake for an investor in a hypothetical 32% ordinary marginal tax bracket versus a 15% qualified/long-term capital gains rate. On JEPI’s 7.06% SEC-type ordinary-dominated cash flow ($7,060), taxing most distributions as ordinary income deducts roughly $2,259 in federal taxes—leaving roughly $4,801 spendable net income (4.80% net yield) before state taxes. An equity-option CEF such as EOS or a Section 1256 index-option ETF like SPYI shifting distributions into 60/40 long-term/short-term capital gains, qualified equity dividends, or basis-reducing ROC trims immediate ordinary-income leakage dramatically—demonstrating why pre-tax yield tables consistently understate EOS and SPYI inside U.S. taxable accounts.
European & Swiss Investors: PRIIPs, 15% WHT, and the $60k Estate Rule
For European retail investors, almost all U.S.-listed CEFs (UTG, UTF, PTY, EOS, and BST) and U.S. covered-call ETFs (JEPI, JEPQ, and SPYI) lack EU PRIIPs Key Information Documents (KIDs), blocking retail purchases at EU/UK brokers unless qualified as professional clients or routed via compliant UCITS alternatives like JPMorgan’s Irish-domiciled JEPG. Moreover, any U.S.-domiciled CEF or ETF counts as a U.S.-situs asset toward the $60,000 non-resident estate tax cliff and carries 15% treaty dividend withholding under Form W-8BEN (whereas Canadian and Swiss investors should also verify local tax accounting carefully: Switzerland, for example, generally taxes ordinary U.S. option-ETF payouts—even distributions classified as Return of Capital on U.S. Form 1099—as ordinary taxable personal income!). Review our complete dividend ETF guide and living-off-dividends blueprint before sizing high-payout funds in retirement portfolios.
When a Closed-End Fund Beats a Covered-Call ETF—and Vice Versa
Choose Select Closed-End Funds (e.g., EOS, UTG, UTF) When:
- Discounts widen well below 5-year averages: Buying unleveraged equity-option CEFs like EOS at an 11%+ discount gives a structural margin of safety ETFs cannot replicate.
- You want real-asset or credit active selection: Utilities (UTG) and infrastructure (UTF) benefit from long-duration real assets, provided you accept −15% to −20% rate-shock drawdowns.
- You hold U.S. taxable accounts prioritizing LTCG/QDI: Equity CEFs distributing long-term gains can beat JEPI’s ordinary ELN taxation.
Choose Covered-Call ETFs (e.g., JEPI, JEPQ, SPYI) When:
- You want zero debt leverage and low fees: A 0.35% fee with 0% bank borrowing drag eliminates margin-call and SOFR-squeeze risk.
- You prioritize tight NAV tracking and liquidity: Never worry about buying at a 10% premium or getting trapped selling into an illiquid −12% discount panic.
- You are pairing with core dividend growth: Use 10%–20% in JEPI or JEPQ alongside core dividend growers rather than replacing equity compounding.
Practical Allocation Rules in a 4%–5% Interest Rate Regime
High-distribution funds exist to turn equity volatility or credit spread into regular cash—not to defy arithmetic. When 10-year Treasuries yield over 5% and Fed funds sit near 3.75%–4.00%, enforce four rules across any CEF or option-ETF sleeve:
- Never buy a CEF above a +5% premium to NAV: Even world-class managers like PIMCO eventually see premiums revert—as PTY’s slide back to par (~−0.09%) demonstrated.
- Separate management fee from leverage interest expense: Verify whether a fund’s 20%–28% borrowing actually clears its 4.5%–5.0%+ funding cost on a 3-to-5-year NAV return basis.
- Check NAV total return—not just monthly payout stability: Any fund paying 10%–13% while 5-year annualized NAV total return sits near 0% (like PTY over the 2021–2026 bond cycle) is distributing principal, not organic earnings.
- Cap leveraged/option income sleeves to 15%–25% of portfolio capital: Anchor core retirement purchasing power in dividend-growing equities and short/intermediate fixed income rather than living solely off capped-upside or leveraged wrappers.
Methodology, Total Return Compounding, and CEF Fee Notes
Growth of $10,000 trajectories are compounded geometrically from calendar-year market-price total returns (distributions reinvested) for 2021–2025 plus 2026 year-to-date through November 2026: JEPI (+21.52%, −3.49%, +9.83%, +12.57%, +8.09%, +6.72%), UTG (+21.98%, −13.38%, +2.84%, +28.10%, +23.24%, −5.94%), UTF (+15.10%, −16.90%, +5.60%, +11.30%, +11.70%, +9.60%), and PTY (+17.66%, −18.71%, +22.56%, +19.88%, −0.50%, −7.51%).
Total expense ratios combine baseline advisory/operating fees and reported leverage interest expense as disclosed in CEFConnect and annual shareholder reports. Actual borrowing spreads fluctuate dynamically with SOFR and credit facility renewals.
Primary Sources and Fund Documentation
- Nuveen / CEFConnect Database — Price, NAV, discount/premium history, effective leverage, and interest expense breakdowns for UTG, UTF, PTY, EOS, and BST.
- Investment Company Institute (ICI): Closed-End Fund Market Perspectives — Industry-wide equity and bond CEF average discounts (2021–2026).
- J.P. Morgan Asset Management — Official fund factsheets, 30-day SEC yields, and 0.35% expense ratios for JEPI and JEPQ.
- NEOS Investments: SPYI Factsheet — Section 1256 option strategy, 0.68% expense ratio, and distribution structure.
- PIMCO & Eaton Vance / Morgan Stanley — Fund disclosures for PTY (management fee, reverse repos) and EOS (unleveraged option overlay).