JEPQ ETF: income, risks & historical performance
A Nasdaq-oriented equity-income fund that trades part of the growth index’s upside for monthly option-linked cash flow.
What investors are buying
Quote source: Yahoo Finance. Delayed USD adjusted close for 27 August 2026; one-session change calculated from the prior available adjusted close. Verify an executable price with your broker.
Explore JEPQ price history
Use the range controls or move across the line to inspect Yahoo Finance adjusted-price history. The chart is rendered directly on this page and does not depend on an external market widget.
Chart source: Yahoo Finance. Delayed adjusted-price history through 27 August 2026. This is not a trading interface or an executable quote.
How JEPQ works
Portfolio engine
JEPQ pairs an actively managed portfolio of U.S. large-cap growth companies with an options-income program implemented through equity-linked notes. It is influenced by the Nasdaq-100 opportunity set, but it is not simply QQQ with a dividend. The active stock book and derivatives overlay both create tracking differences.
Where the income comes from
Stock dividends provide only part of the distribution. Most of the income ambition comes from monetizing market volatility through call exposure embedded in equity-linked notes. The monthly payment therefore varies with volatility, gains, portfolio income and the manager’s implementation.
For analysis, separate three moving parts: the cash distributed, the change in NAV or market price, and the tax character of the payment. Only their combined effect describes the investor’s economic result.
Return, volatility and drawdown
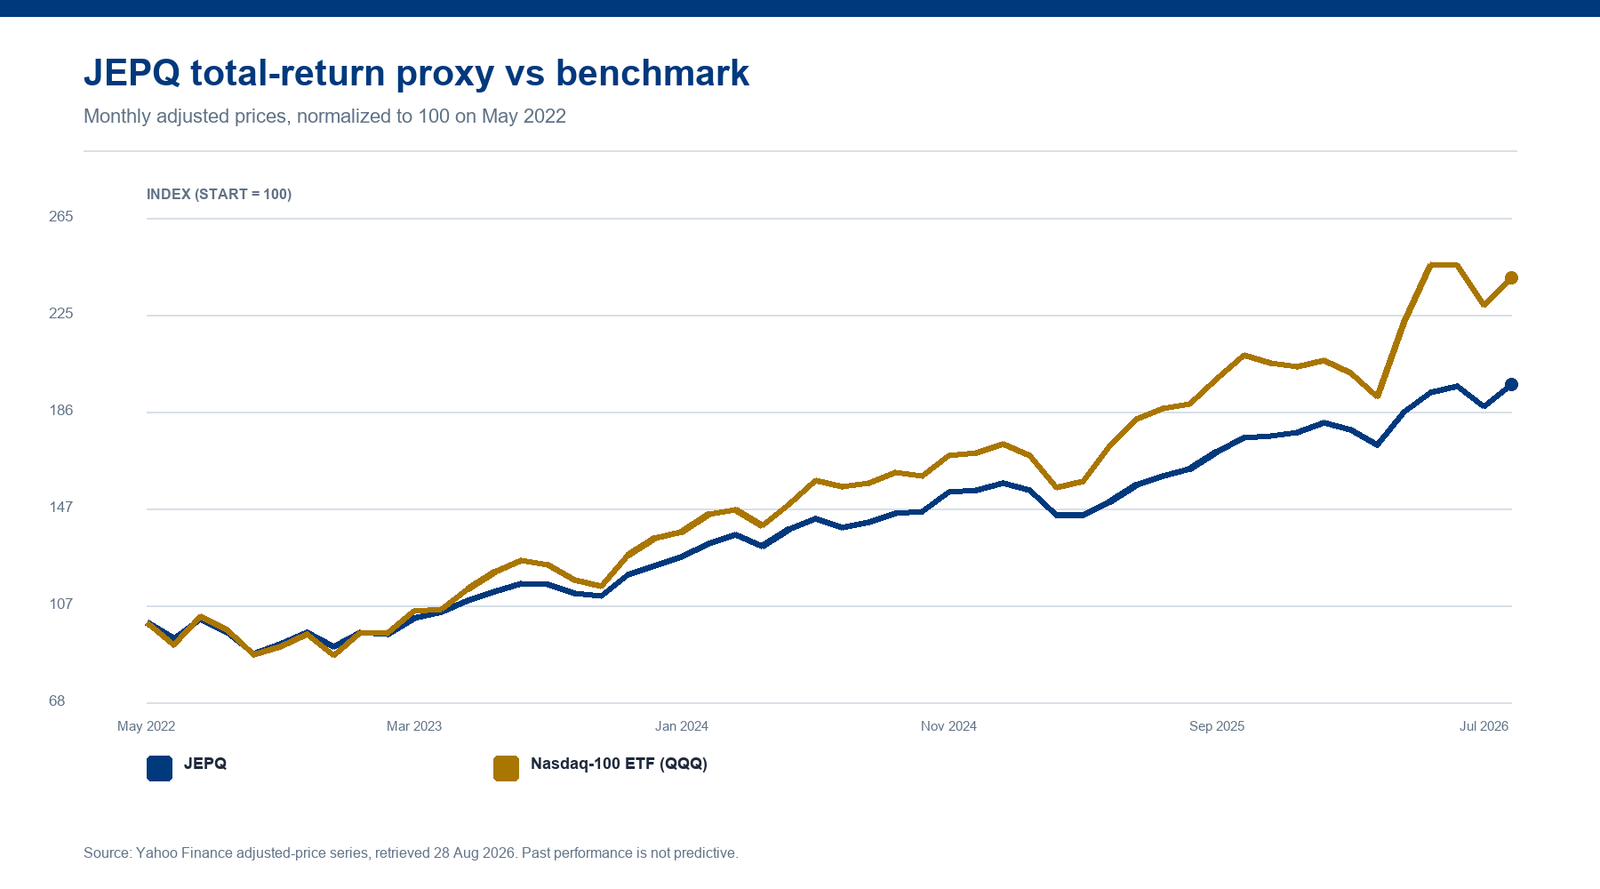
JEPQ launched in May 2022, so every long-term statistic rests on a short record that began during a technology bear market. Its relative results are useful evidence, but they are not proof of how the fund will behave through a full credit, inflation and valuation cycle.
| Period | JEPQ | Nasdaq-100 ETF (QQQ) | Relative result |
|---|---|---|---|
| 2022* | -9.5% | -13.1% | +3.6% |
| 2023 | +36.3% | +54.9% | -18.6% |
| 2024 | +24.8% | +25.6% | -0.7% |
| 2025 | +15.2% | +20.8% | -5.6% |
| 2026 YTD | +11.1% | +17.7% | -6.5% |
Adjusted-price return proxy. 2026 is through the latest available session. An asterisk marks a partial first calendar year. Figures can differ from issuer-reported NAV returns.
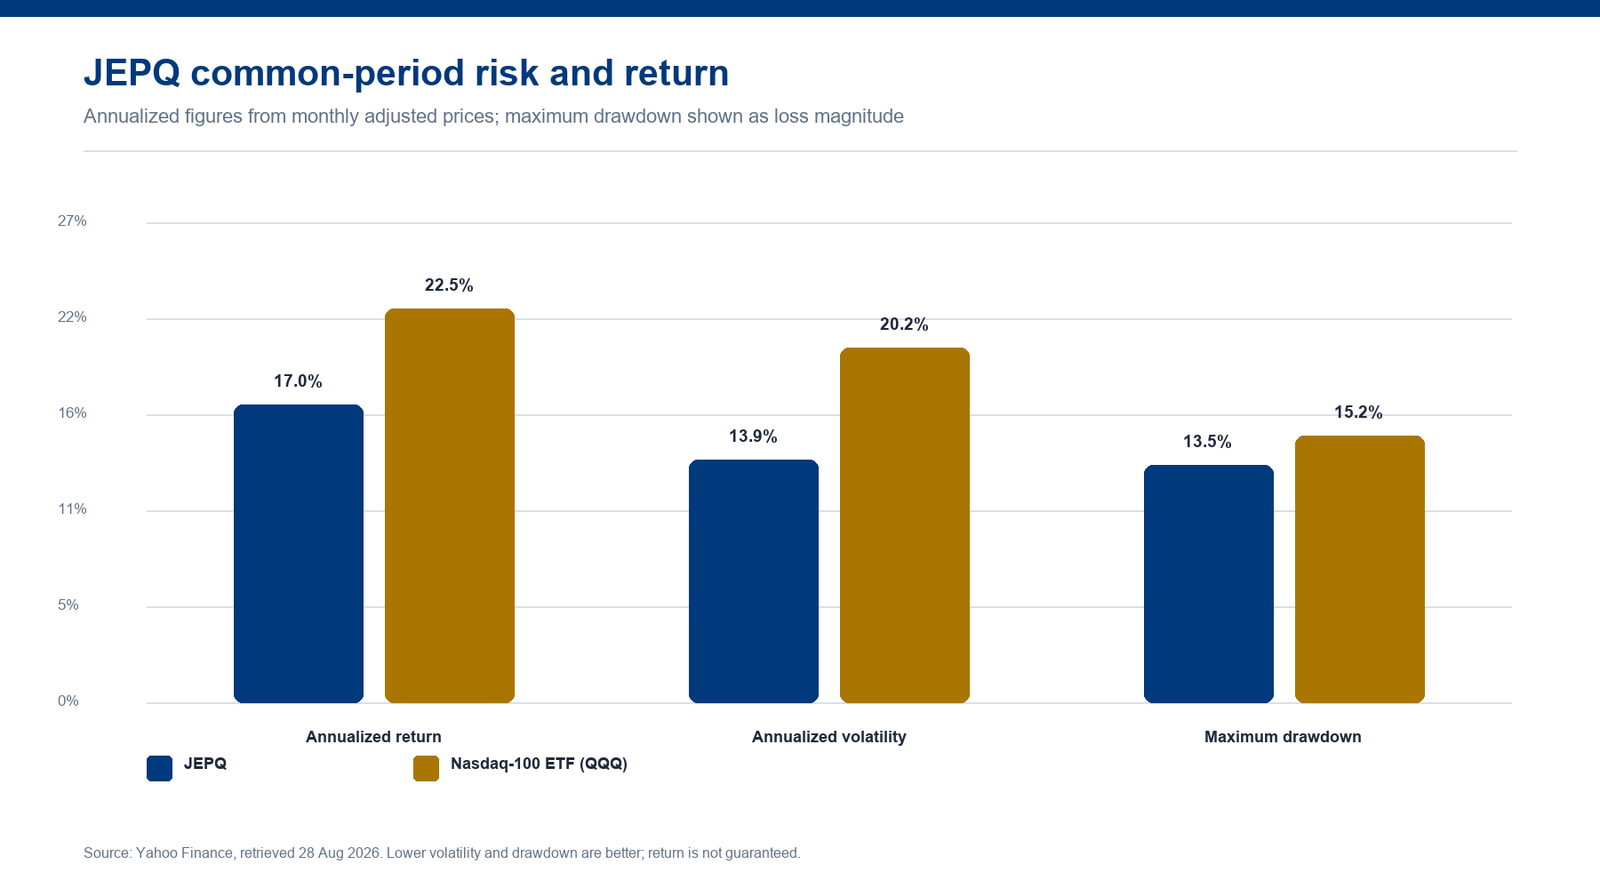
Common period: May 2022 to August 2026. JEPQ annualized return proxy 17.0%, annualized monthly volatility 13.9%, maximum monthly-observation drawdown -13.5%. Historical statistics are sensitive to the start date and are not forecasts.
The thesis and the failure case
What can go right
A technology- and growth-oriented stock book can provide more capital-growth potential than a defensive equity-income fund, while the option program converts some volatility into spendable cash.
What can go wrong
The same growth concentration can amplify drawdowns. Written call exposure can limit participation in a fast Nasdaq rally, while equity-linked notes introduce counterparty and structure risk. A high monthly payout can coexist with material NAV volatility.
Income-oriented investors comfortable with growth-stock concentration who accept capped upside in exchange for monthly distributions.
Investors seeking a bond substitute, a stable payout, or pure Nasdaq-100 upside without derivative exposure.
Four checks before investing
- Compare total return with QQQ over identical dates, including reinvested distributions.
- Monitor technology and communication-services concentration in the active portfolio.
- Calculate how much upside the options program surrendered during strong Nasdaq quarters.
- Treat the short track record as a reason to size the position conservatively.
Sources & methodology
- J.P. Morgan JEPQ fact sheet — strategy, inception, expense ratio and distribution framework.
- Yahoo Finance JEPQ historical data — delayed quote and adjusted-price history used for the independent charts.