VYM ETF: income, risks & historical performance
A low-cost, broadly diversified portfolio of above-average-yielding U.S. shares—built for simple equity income rather than option-enhanced distributions.
What investors are buying
Quote source: Yahoo Finance. Delayed USD adjusted close for 27 August 2026; one-session change calculated from the prior available adjusted close. Verify an executable price with your broker.
Explore VYM price history
Use the range controls or move across the line to inspect Yahoo Finance adjusted-price history. The chart is rendered directly on this page and does not depend on an external market widget.
Chart source: Yahoo Finance. Delayed adjusted-price history through 27 August 2026. This is not a trading interface or an executable quote.
How VYM works
Portfolio engine
VYM tracks the FTSE High Dividend Yield Index. It emphasizes U.S. companies forecast to pay above-average dividends while retaining broad diversification. Unlike covered-call funds, it does not sell away market upside to finance the distribution.
Where the income comes from
The quarterly distribution is funded primarily by dividends from portfolio companies. The fund’s yield rises and falls with those dividends and with VYM’s share price. Because the index weights larger companies more heavily, the portfolio behaves more like a broad value-oriented equity fund than a concentrated list of extreme yields.
For analysis, separate three moving parts: the cash distributed, the change in NAV or market price, and the tax character of the payment. Only their combined effect describes the investor’s economic result.
Return, volatility and drawdown
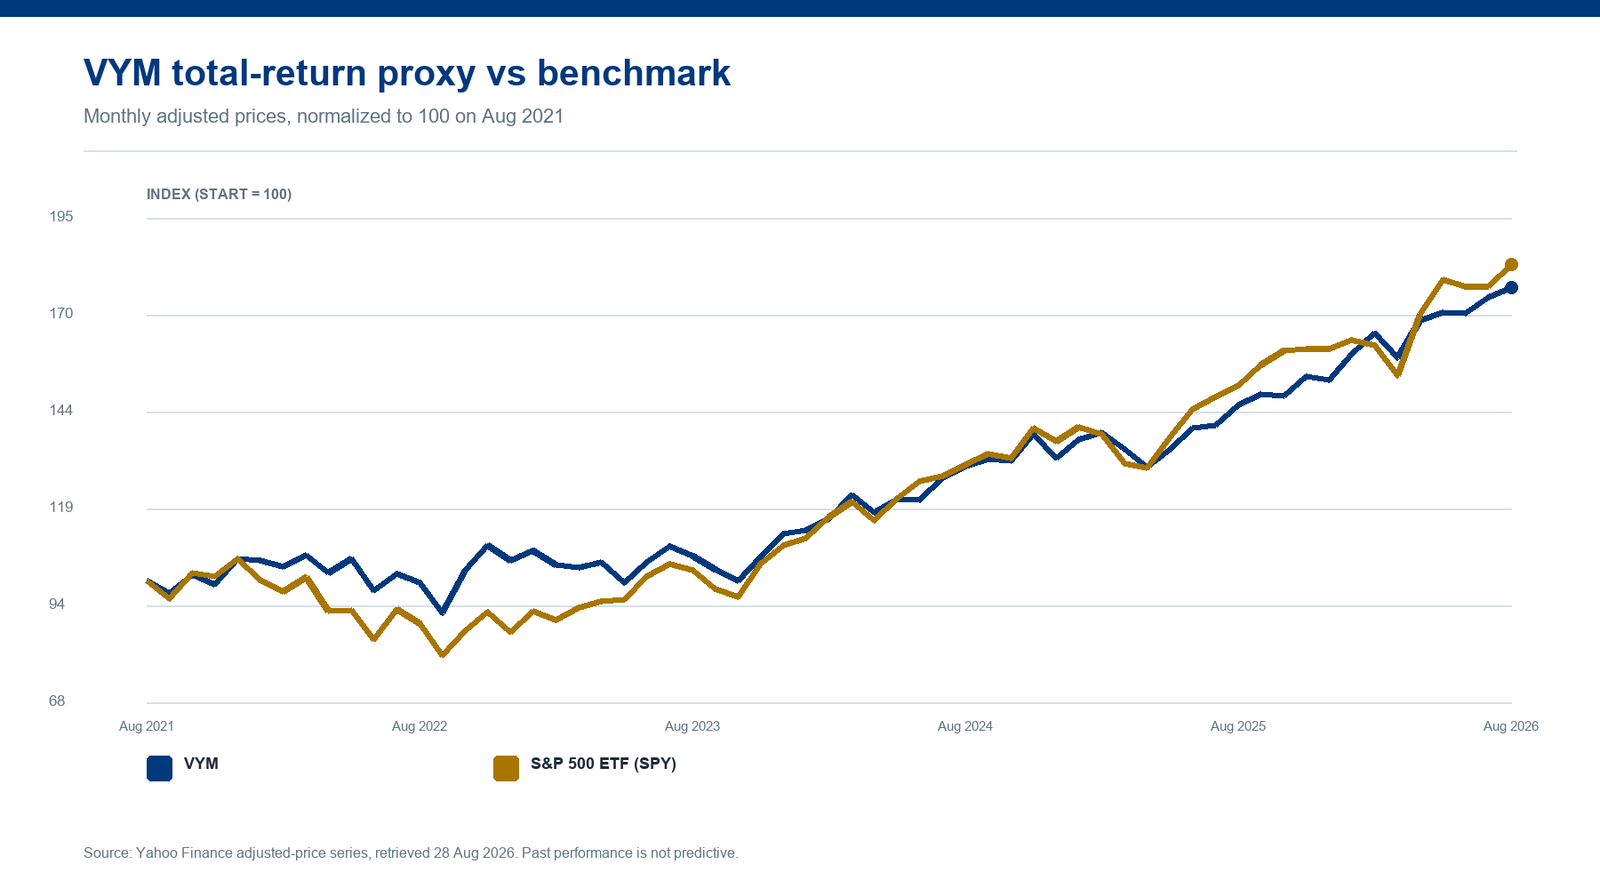
VYM has the longest live record in this group, including the global financial crisis, the pandemic shock and multiple rate regimes. That history is useful, but adjusted-price comparisons still depend on the selected start date and do not incorporate an investor’s tax or trading costs.
| Period | VYM | S&P 500 ETF (SPY) | Relative result |
|---|---|---|---|
| 2022 | -0.4% | -18.2% | +17.7% |
| 2023 | +6.6% | +26.2% | -19.6% |
| 2024 | +17.6% | +24.9% | -7.3% |
| 2025 | +15.4% | +17.7% | -2.3% |
| 2026 YTD | +15.9% | +13.7% | +2.3% |
Adjusted-price return proxy. 2026 is through the latest available session. An asterisk marks a partial first calendar year. Figures can differ from issuer-reported NAV returns.
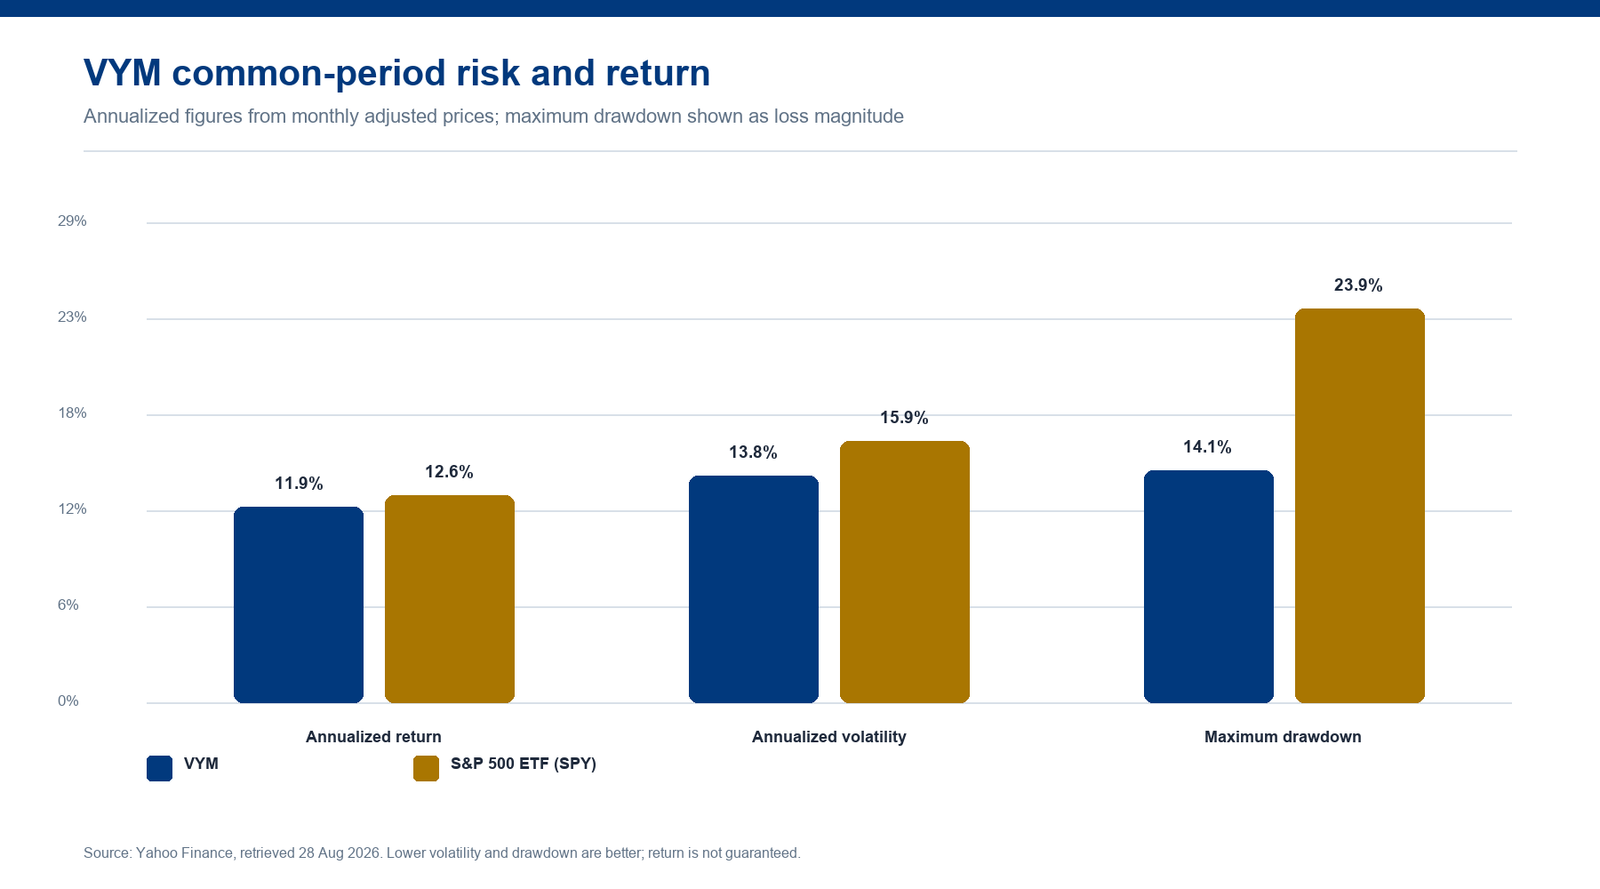
Common period: August 2021 to August 2026. VYM annualized return proxy 11.9%, annualized monthly volatility 13.8%, maximum monthly-observation drawdown -14.1%. Historical statistics are sensitive to the start date and are not forecasts.
The thesis and the failure case
What can go right
Very low stated costs and broad diversification make VYM a straightforward income core. It can participate fully in market gains because it does not systematically write calls over the portfolio.
What can go wrong
A high-dividend screen can lean toward mature financial, energy, industrial and consumer businesses while underweighting non-payers. The portfolio remains fully exposed to equity bear markets, and a broad index can still own companies before a dividend cut.
Cost-conscious investors seeking broad U.S. equity income, quarterly distributions and a rules-based portfolio without derivatives.
Investors requiring monthly cash, a fixed yield, or a growth-heavy market portfolio.
Four checks before investing
- Review sector and top-ten concentration rather than assuming every broad ETF is neutral.
- Measure dividend growth and total return against both SCHD and a broad-market fund.
- Check whether a rising yield reflects stronger distributions or a falling share price.
- Model withholding and account-level tax treatment for non-U.S. investors.
Sources & methodology
- Vanguard VYM fund profile — strategy, inception, expense ratio and distribution framework.
- Yahoo Finance VYM historical data — delayed quote and adjusted-price history used for the independent charts.