QYLD ETF: income, risks & historical performance
A systematic covered-call strategy built to turn Nasdaq-100 volatility into monthly distributions—while giving up much of the index’s upside.
What investors are buying
Quote source: Yahoo Finance. Delayed USD adjusted close for 27 August 2026; one-session change calculated from the prior available adjusted close. Verify an executable price with your broker.
Explore QYLD price history
Use the range controls or move across the line to inspect Yahoo Finance adjusted-price history. The chart is rendered directly on this page and does not depend on an external market widget.
Chart source: Yahoo Finance. Delayed adjusted-price history through 27 August 2026. This is not a trading interface or an executable quote.
How QYLD works
Portfolio engine
QYLD owns the Nasdaq-100 stocks and writes index call options under a rules-based buy-write methodology. The option premium supplies cash, but the sold calls transfer much of the market’s upside above the strike to the option buyer. That economic exchange—not the distribution percentage—is the core investment concept.
Where the income comes from
QYLD normally distributes monthly. The cash can reflect option premium, portfolio income, gains and estimated return of capital. Global X explicitly warns that its distribution rate is not total return and that some recent distributions were estimated to include return of capital. Final tax character is determined later.
For analysis, separate three moving parts: the cash distributed, the change in NAV or market price, and the tax character of the payment. Only their combined effect describes the investor’s economic result.
Return, volatility and drawdown
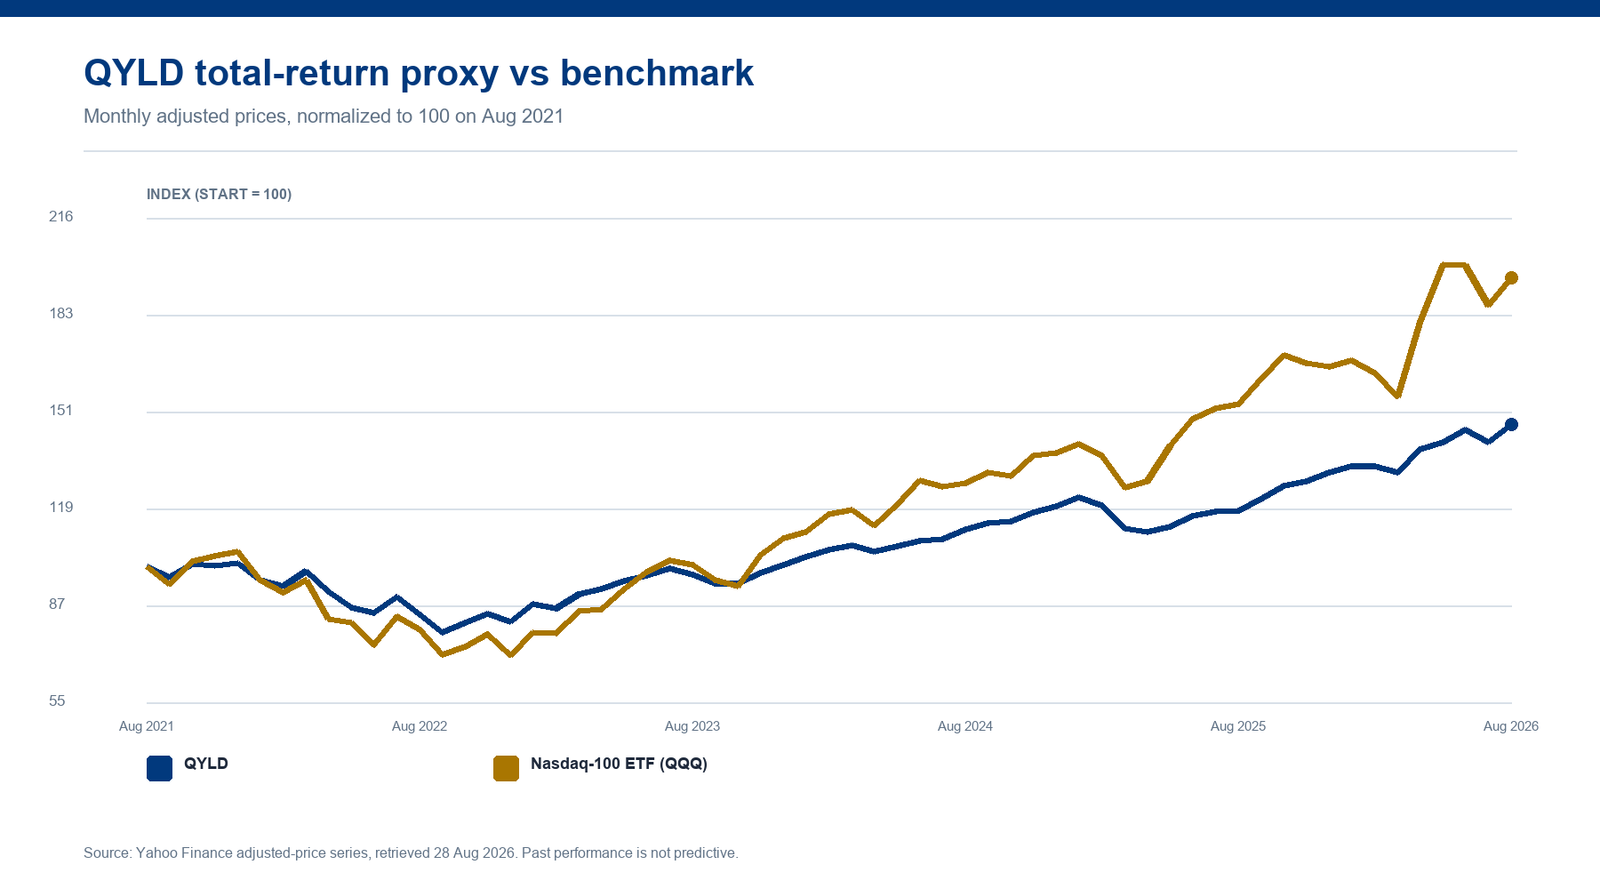
QYLD’s history shows why covered-call funds must be judged with adjusted-price total return. A large cash distribution can feel productive while the strategy trails an uncovered growth index during powerful rallies. Conversely, option premium can cushion—not eliminate—some losses in sideways or moderately falling markets.
| Period | QYLD | Nasdaq-100 ETF (QQQ) | Relative result |
|---|---|---|---|
| 2022 | -19.1% | -32.6% | +13.5% |
| 2023 | +22.8% | +54.9% | -32.1% |
| 2024 | +19.4% | +25.6% | -6.2% |
| 2025 | +9.3% | +20.8% | -11.5% |
| 2026 YTD | +12.1% | +17.7% | -5.6% |
Adjusted-price return proxy. 2026 is through the latest available session. An asterisk marks a partial first calendar year. Figures can differ from issuer-reported NAV returns.
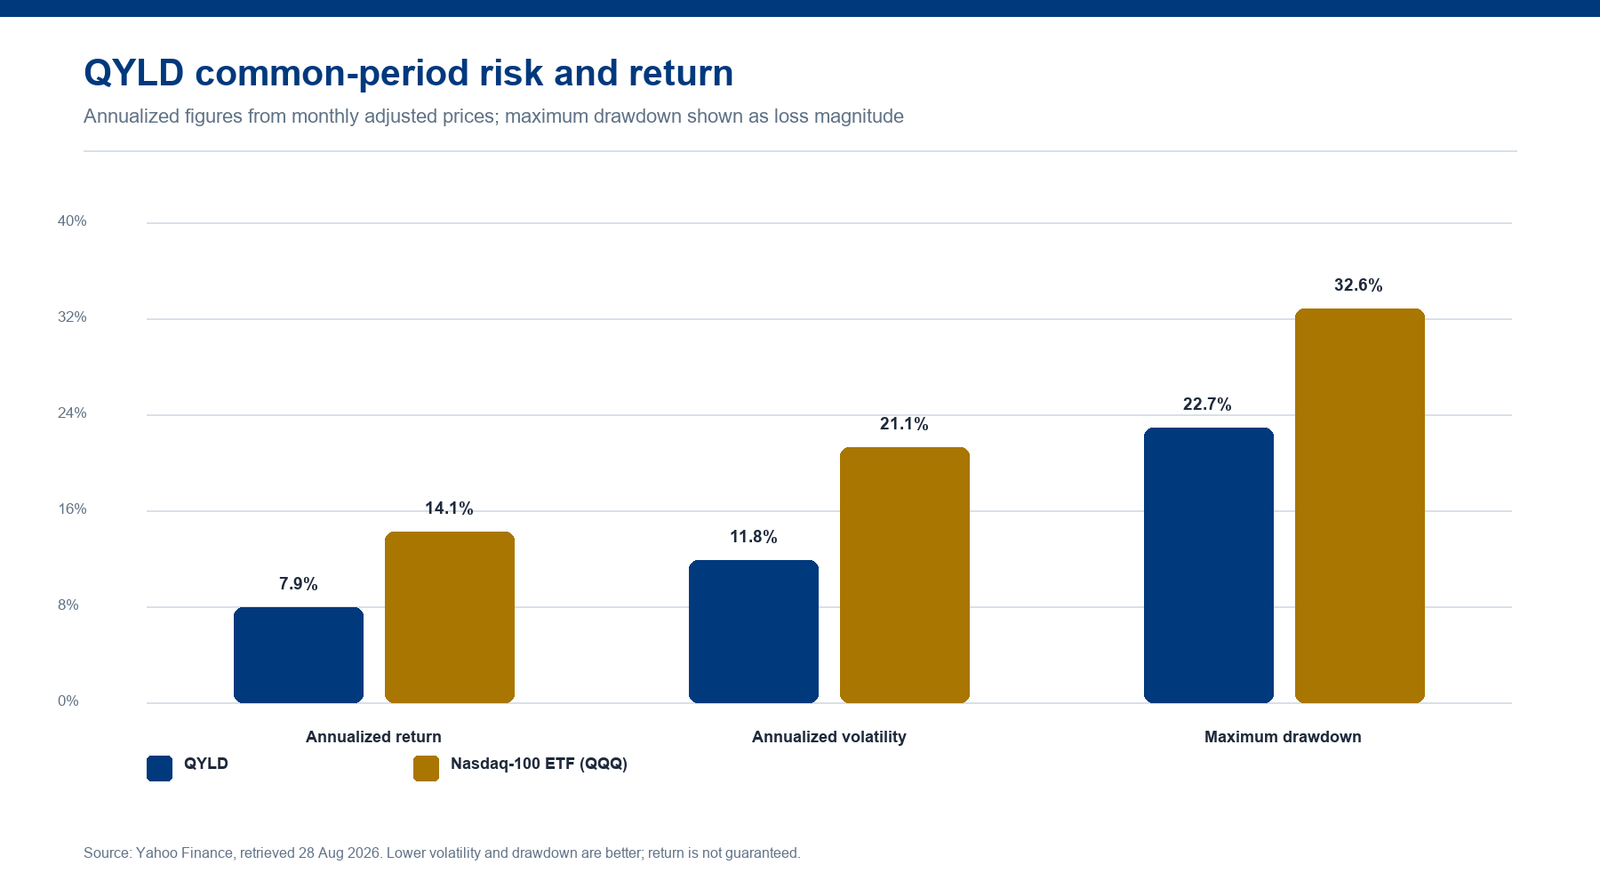
Common period: August 2021 to August 2026. QYLD annualized return proxy 7.9%, annualized monthly volatility 11.8%, maximum monthly-observation drawdown -22.7%. Historical statistics are sensitive to the start date and are not forecasts.
The thesis and the failure case
What can go right
Systematic call writing can create substantial, frequent cash flow and may reduce volatility relative to owning the Nasdaq-100 without an overlay. The rules are transparent and do not depend on discretionary market timing.
What can go wrong
Upside is structurally capped while downside remains economically significant after the premium cushion. Technology concentration, NAV erosion, changing distribution composition and higher costs than plain index ETFs all matter. Return of capital is not automatically harmful, but it demands reconciliation with total return and tax records.
Investors who deliberately prioritize current monthly cash over long-run Nasdaq upside and can monitor NAV, tax character and total return.
Growth accumulators, investors treating distributions as guaranteed interest, or anyone selecting funds solely by headline yield.
Four checks before investing
- Compare adjusted-price total return with QQQ over the same dates.
- Track NAV per share alongside every distribution and any return-of-capital estimate.
- Measure upside capture during strong Nasdaq quarters and downside capture during selloffs.
- Use final tax documents—not interim estimates—to determine distribution character.
Sources & methodology
- Global X QYLD fund profile — strategy, inception, expense ratio and distribution framework.
- Yahoo Finance QYLD historical data — delayed quote and adjusted-price history used for the independent charts.