SCHD ETF: income, risks & historical performance
A quality-screened dividend portfolio designed for investors who care about the durability and growth of income—not just today’s headline yield.
What investors are buying
Quote source: Yahoo Finance. Delayed USD adjusted close for 27 August 2026; one-session change calculated from the prior available adjusted close. Verify an executable price with your broker.
Explore SCHD price history
Use the range controls or move across the line to inspect Yahoo Finance adjusted-price history. The chart is rendered directly on this page and does not depend on an external market widget.
Chart source: Yahoo Finance. Delayed adjusted-price history through 27 August 2026. This is not a trading interface or an executable quote.
How SCHD works
Portfolio engine
SCHD tracks the Dow Jones U.S. Dividend 100 Index. The strategy starts with established U.S. dividend payers, then uses index rules intended to emphasize financial quality and dividend sustainability. That makes SCHD a dividend-factor portfolio, not a simple list of the market’s highest-yielding shares.
Where the income comes from
Cash distributions come from dividends paid by the underlying companies. There is no covered-call overlay manufacturing option premium. Payments are normally quarterly, but neither the amount nor the yield is guaranteed; both change with portfolio dividends, index reconstitution and the fund’s market price.
For analysis, separate three moving parts: the cash distributed, the change in NAV or market price, and the tax character of the payment. Only their combined effect describes the investor’s economic result.
Return, volatility and drawdown
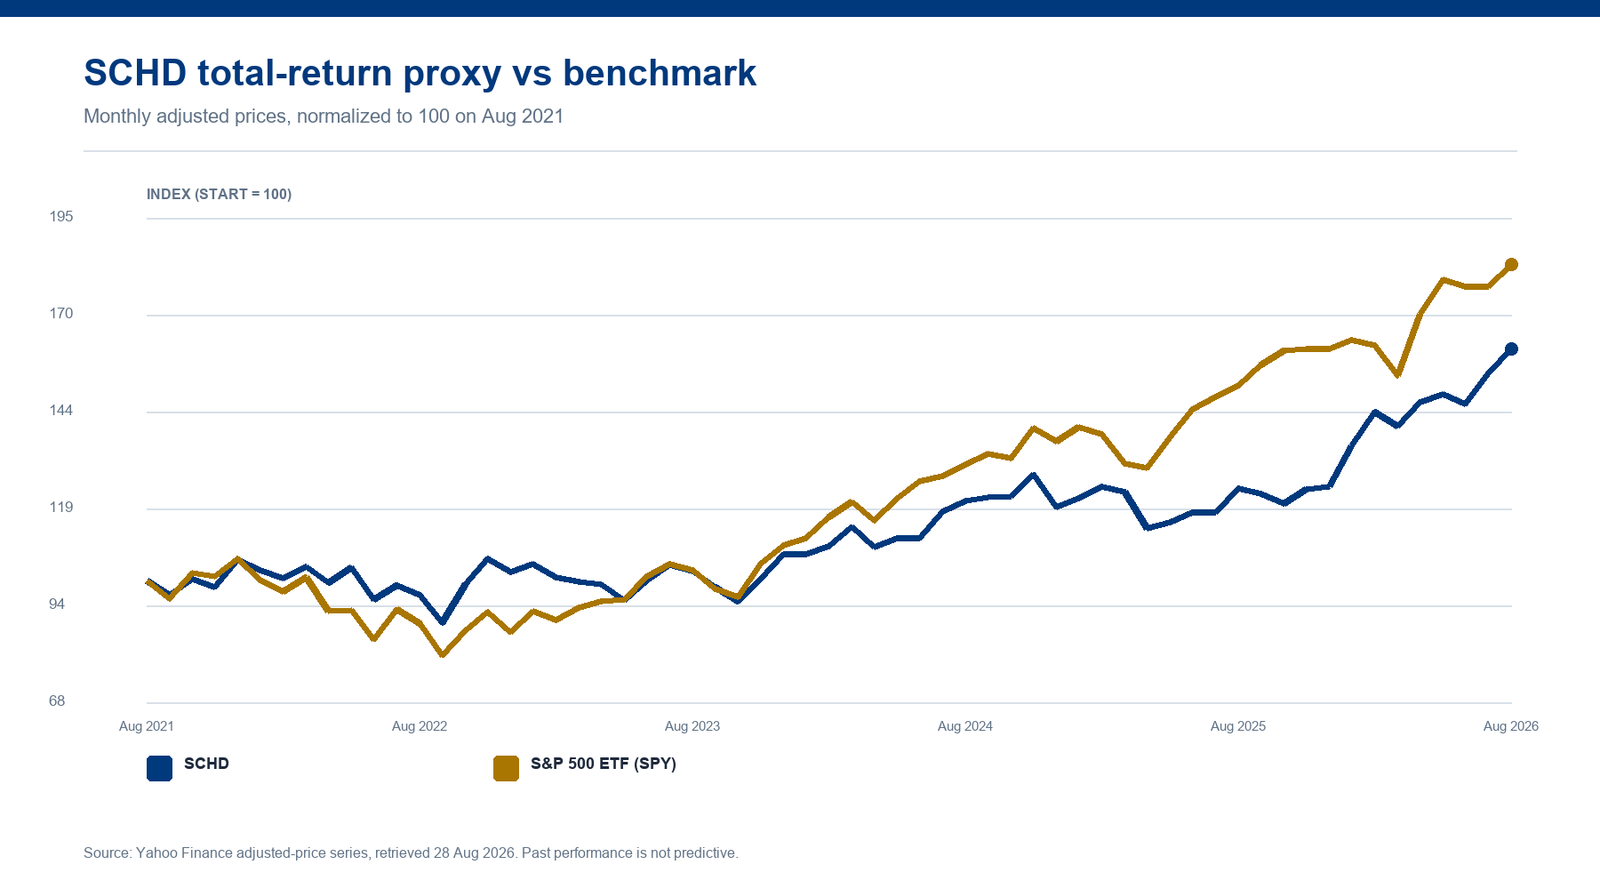
The important historical question is whether SCHD’s quality and value tilts compensated investors when growth stocks led the market. The comparison below uses adjusted prices as a total-return proxy, so it reflects distributions where Yahoo’s series provides them. It is a decision aid—not an audited performance presentation.
| Period | SCHD | S&P 500 ETF (SPY) | Relative result |
|---|---|---|---|
| 2022 | -3.3% | -18.2% | +14.9% |
| 2023 | +4.5% | +26.2% | -21.6% |
| 2024 | +11.7% | +24.9% | -13.2% |
| 2025 | +4.3% | +17.7% | -13.4% |
| 2026 YTD | +29.1% | +13.7% | +15.4% |
Adjusted-price return proxy. 2026 is through the latest available session. An asterisk marks a partial first calendar year. Figures can differ from issuer-reported NAV returns.
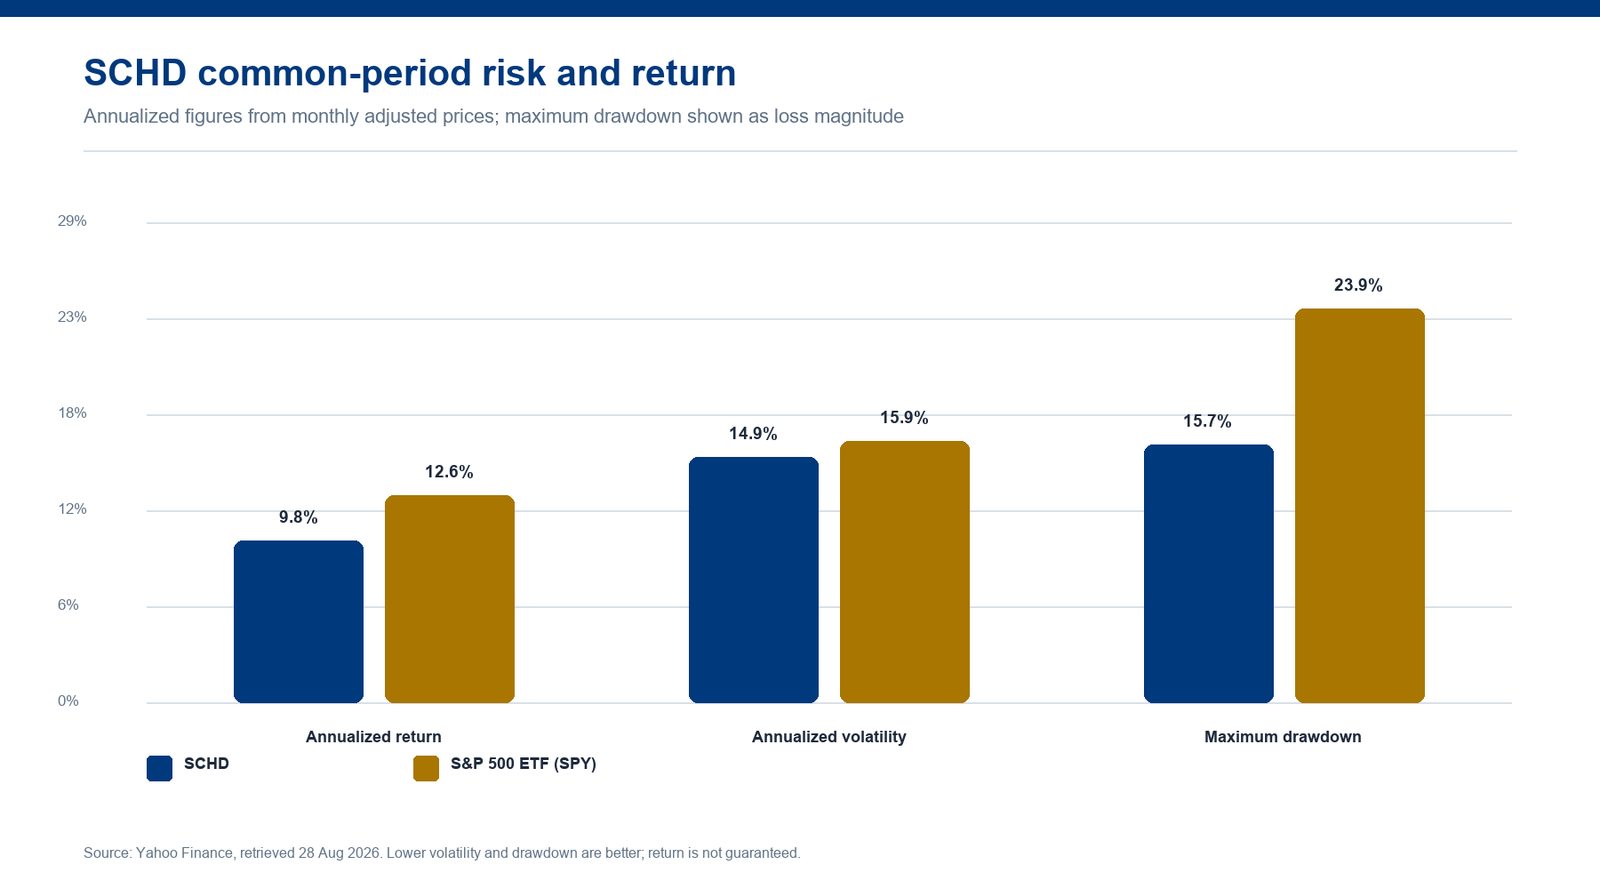
Common period: August 2021 to August 2026. SCHD annualized return proxy 9.8%, annualized monthly volatility 14.9%, maximum monthly-observation drawdown -15.7%. Historical statistics are sensitive to the start date and are not forecasts.
The thesis and the failure case
What can go right
The index discipline can avoid some fragile high-yield companies while retaining exposure to profitable cash-generative businesses. If dividend growth broadens beyond mega-cap technology, SCHD’s relative profile can improve.
What can go wrong
Factor concentration is real. SCHD can lag when non-dividend growth stocks dominate, and a quality screen cannot prevent dividend cuts. Sector weights can also differ materially from the broad market after reconstitution.
Long-horizon investors seeking a transparent U.S. dividend-growth core, quarterly cash flow and a very low stated expense ratio.
Investors who need a fixed payout, broad-market-like sector weights, or maximum participation in growth-led rallies.
Four checks before investing
- Compare dividend growth per share with inflation—not only the current yield.
- Review sector weights and the largest positions after each index reconstitution.
- Measure total return against a broad U.S. equity benchmark over full market cycles.
- Watch whether the aggregate earnings payout ratio and balance-sheet quality deteriorate.
Sources & methodology
- Schwab SCHD fund profile — strategy, inception, expense ratio and distribution framework.
- Yahoo Finance SCHD historical data — delayed quote and adjusted-price history used for the independent charts.