JEPI ETF: income, risks & historical performance
A monthly-income strategy that combines an actively selected, lower-volatility U.S. equity portfolio with option-linked income—and accepts an upside trade-off to get it.
What investors are buying
Quote source: Yahoo Finance. Delayed USD adjusted close for 27 August 2026; one-session change calculated from the prior available adjusted close. Verify an executable price with your broker.
Explore JEPI price history
Use the range controls or move across the line to inspect Yahoo Finance adjusted-price history. The chart is rendered directly on this page and does not depend on an external market widget.
Chart source: Yahoo Finance. Delayed adjusted-price history through 27 August 2026. This is not a trading interface or an executable quote.
How JEPI works
Portfolio engine
JEPI owns an actively selected portfolio of large U.S. companies and seeks additional income through equity-linked notes that embed an options strategy. The manager’s objective is not to replicate the S&P 500. It is to deliver a meaningful share of equity-market returns with lower volatility and a steadier monthly income profile.
Where the income comes from
Monthly distributions combine stock dividends and option-related cash flow generated through equity-linked notes. Option premium tends to rise with market volatility, so the distribution can move from month to month. A high trailing distribution rate is not a contractual yield and should never be multiplied indefinitely in a retirement plan.
For analysis, separate three moving parts: the cash distributed, the change in NAV or market price, and the tax character of the payment. Only their combined effect describes the investor’s economic result.
Return, volatility and drawdown
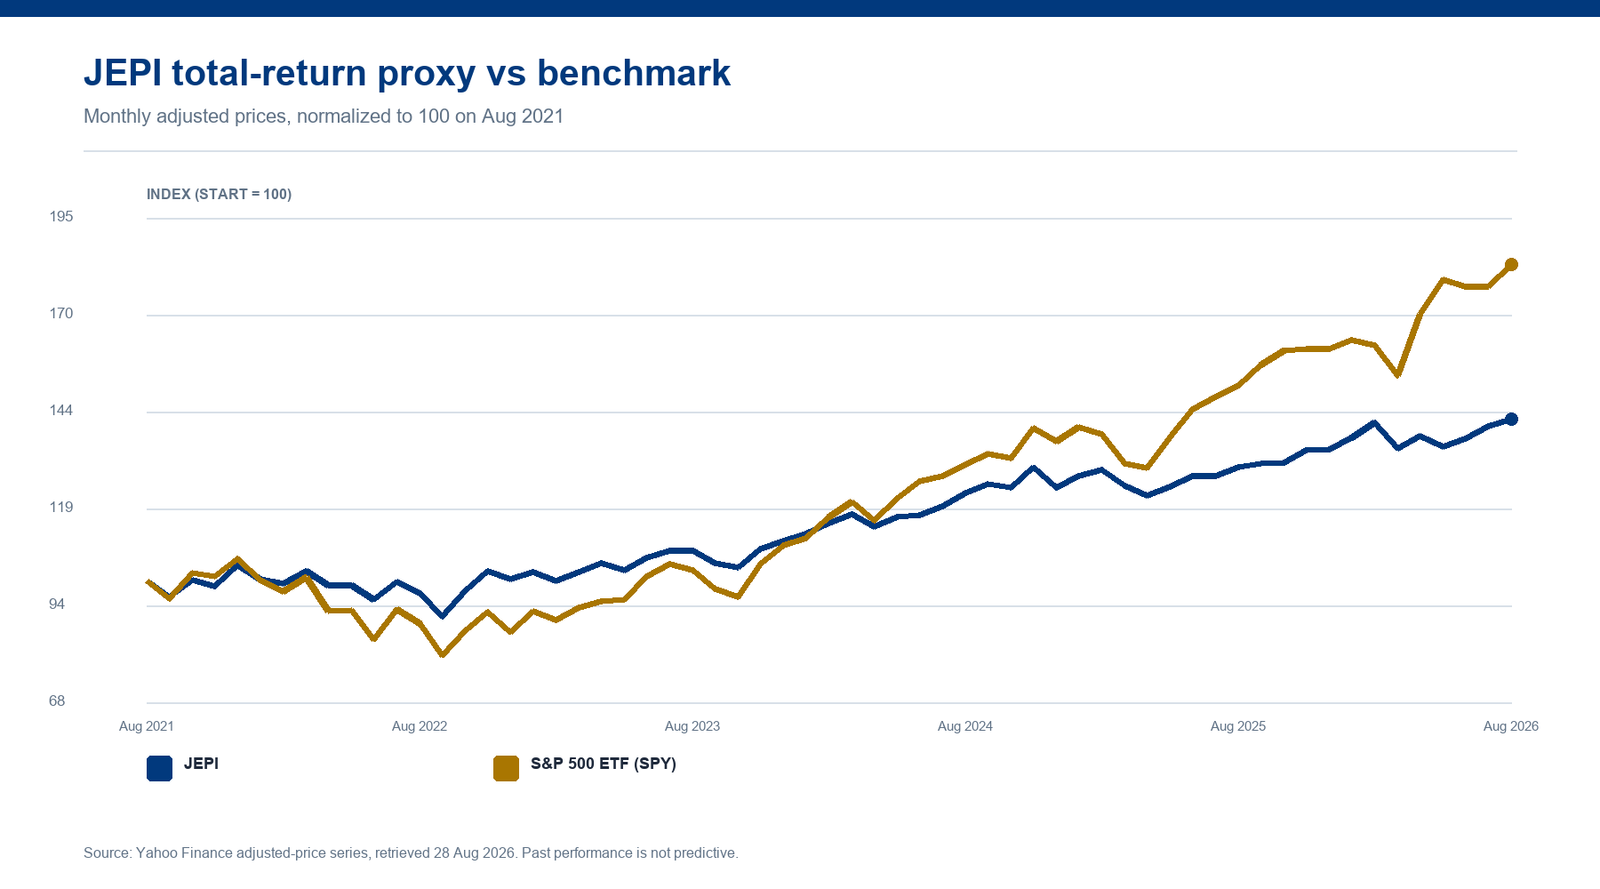
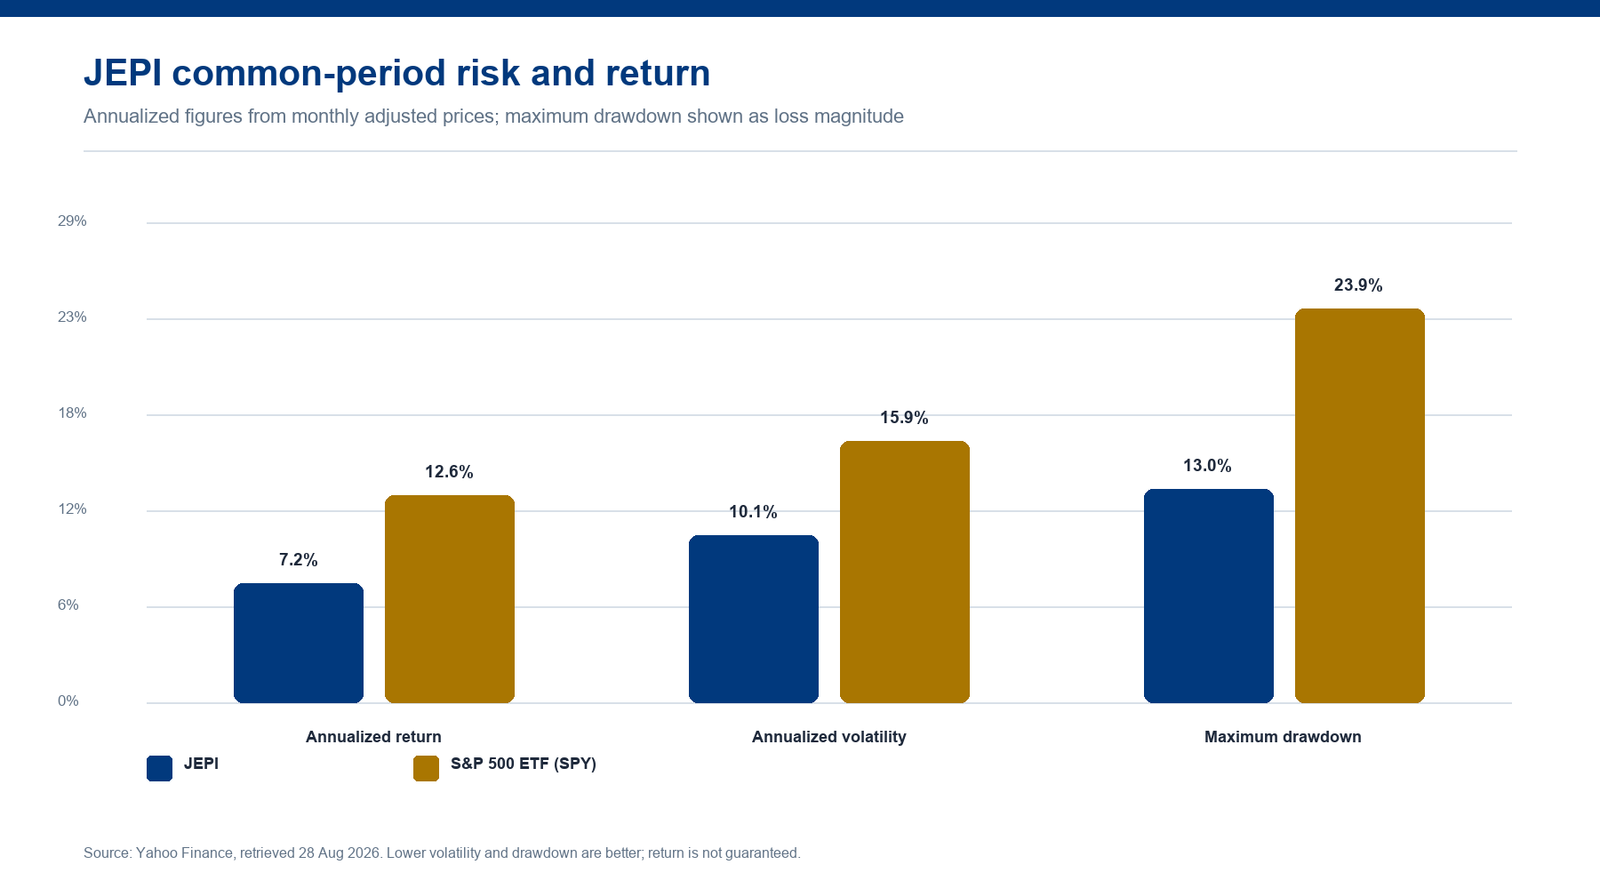
JEPI’s live record began in 2020, so the available history includes a sharp bear market and a strong technology-led rebound but not several complete economic cycles. The relevant comparison is not payout frequency; it is total return, volatility and downside behavior versus a broad equity alternative.
| Period | JEPI | S&P 500 ETF (SPY) | Relative result |
|---|---|---|---|
| 2022 | -3.5% | -18.2% | +14.7% |
| 2023 | +9.8% | +26.2% | -16.4% |
| 2024 | +12.6% | +24.9% | -12.3% |
| 2025 | +8.1% | +17.7% | -9.6% |
| 2026 YTD | +6.0% | +13.7% | -7.7% |
Adjusted-price return proxy. 2026 is through the latest available session. An asterisk marks a partial first calendar year. Figures can differ from issuer-reported NAV returns.
Common period: August 2021 to August 2026. JEPI annualized return proxy 7.2%, annualized monthly volatility 10.1%, maximum monthly-observation drawdown -13.0%. Historical statistics are sensitive to the start date and are not forecasts.
The thesis and the failure case
What can go right
The defensive stock selection and option premium may soften some drawdowns and fund a higher cash distribution than a conventional equity index. The structure can be useful when markets are volatile but not relentlessly rising.
What can go wrong
Call exposure can surrender part of a powerful rally. Equity-linked notes add issuer and structural risk, and the active portfolio can underperform through security selection. Monthly distributions are variable and may include components taxed differently from qualified dividends.
Investors prioritizing current monthly cash flow and somewhat lower equity volatility over full upside participation.
Tax-sensitive accumulators, investors expecting a fixed coupon, or anyone who would regret lagging a strong bull market.
Four checks before investing
- Separate distribution yield from total return and NAV growth.
- Track upside capture and downside capture against the S&P 500 over rolling periods.
- Read the derivatives and equity-linked-note disclosures, including counterparty exposure.
- Model after-tax income because option-related distributions may receive different treatment.
Sources & methodology
- J.P. Morgan JEPI fact sheet — strategy, inception, expense ratio and distribution framework.
- Yahoo Finance JEPI historical data — delayed quote and adjusted-price history used for the independent charts.