For three decades, foreign income investors treated Tokyo as a value trap dressed up in strong balance sheets: Japanese corporations hoarded trillions of yen in idle cash, parked capital inside friendly cross-shareholdings, and mailed out token dividends paying barely 1% to 1.5%. Between 2023 and 2026, the Tokyo Stock Exchange (TSE) dismantled that defensive fortress.
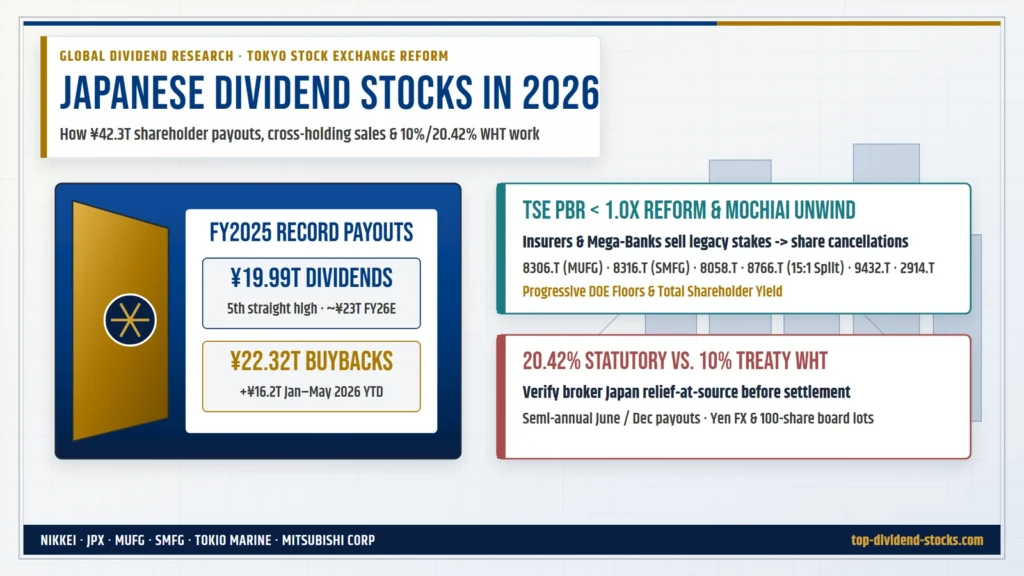
Look at the scale of the capital-return inflection. In fiscal 2025 (ended March 2026), aggregate cash dividends paid by Japanese listed corporations reached a record ¥19.99 trillion—marking a fifth consecutive annual high—while announced share buybacks surged roughly 18% year-over-year to an all-time record of ¥22.32 trillion. Momentum did not fade in calendar 2026: between January and May 2026 alone, Japanese firms authorized more than ¥16.2 trillion in new share repurchases, while Nikkei surveys project FY2026 corporate dividends climbing further toward ¥23 trillion.
For global income portfolios already diversified across European dividend champions, Canadian banks, and Australian franking payers, Japan has suddenly become an essential total-shareholder-yield engine. Yet Japanese dividend stocks behave differently from U.S. Dividend Aristocrats: yields cluster in the 2.3%–4.6% range rather than 6%+, payouts arrive mostly in two semi-annual lumps rather than quarterly checks, and cross-border investors face a 20.42% statutory withholding tax unless properly documented under a 10% or 15% tax treaty.
Executive Summary: Japanese Dividend Stocks & TSE Reform (November 2026)
- Governance reform unlocked balance sheets: The TSE’s 2023 mandate pressuring sub-1.0x Price-to-Book (PBR) companies pushed total corporate shareholder returns (dividends + buybacks) past ¥42.3 trillion in FY2025.
- Cross-shareholding liquidations fund buybacks: Mega-banks (MUFG, SMFG) and insurers (Tokio Marine) systematically sell legacy corporate equity stakes and recycle proceeds into share cancellations and progressive dividend floors.
- Total shareholder yield beats headline yield: Flagship Japanese blue chips pay 2.3%–3.3% cash dividends alongside 2%–5% annual buyback retirements, lifting combined cash-return yields toward 5%–8%.
- Watch currency and withholding plumbing: Non-residents face 20.42% statutory withholding (reduced to 10% under U.S. and Swiss portfolio treaties or 10%–15% across EU treaties); NISA tax-free accounts apply strictly to Japanese tax residents.
Inside the TSE Capital-Efficiency Revolution: How Sub-1x PBR Forced Payouts Higher
The structural catalyst began in March 2023, when the Tokyo Stock Exchange took an unusual step for a Western-style exchange operator: it publicly pressured TSE Prime and Standard companies trading below a Price-to-Book Ratio (PBR) of 1.0x to disclose concrete capital-efficiency plans targeting Return on Equity (ROE) above 8% and cost-of-capital awareness. Companies ignoring the request faced public naming-and-shaming lists starting in 2024 and escalated governance scrutiny through 2025–2026.
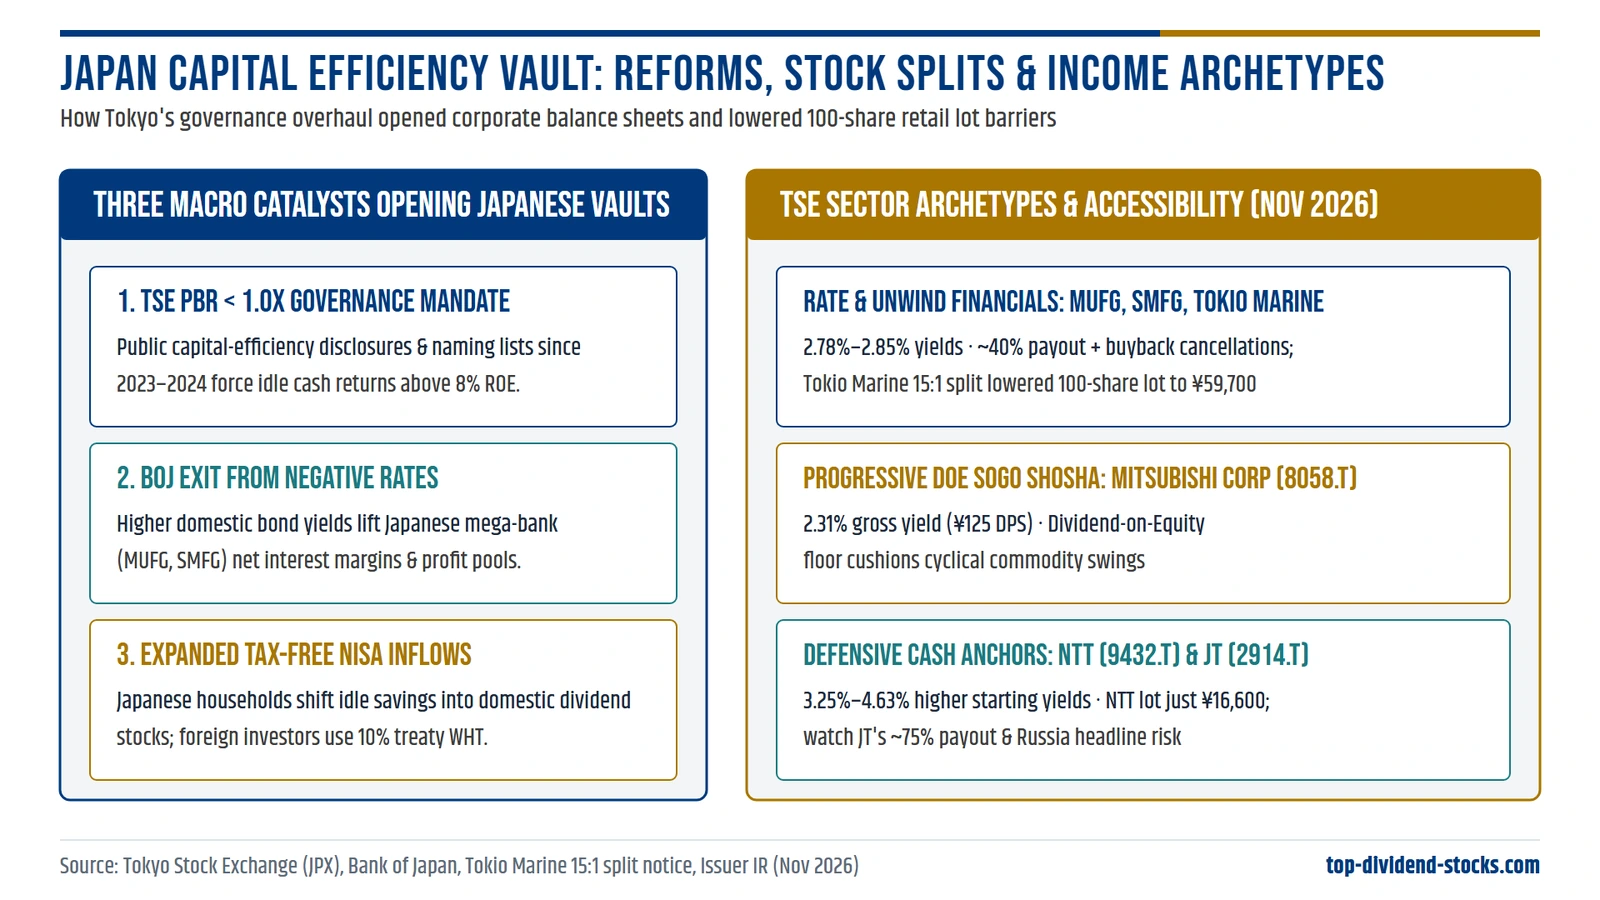
Simultaneously, two macroeconomic and domestic policy shifts amplified the TSE’s governance push. First, the Bank of Japan’s exit from negative interest rates transformed domestic net interest margins across Japanese mega-banks after years of near-zero spreads. Second, Japan’s expanded tax-free Nippon Individual Savings Account (NISA) framework galvanized household inflows out of stagnant bank deposits into dividend-paying domestic equities—creating a local retail constituency demanding predictable income.
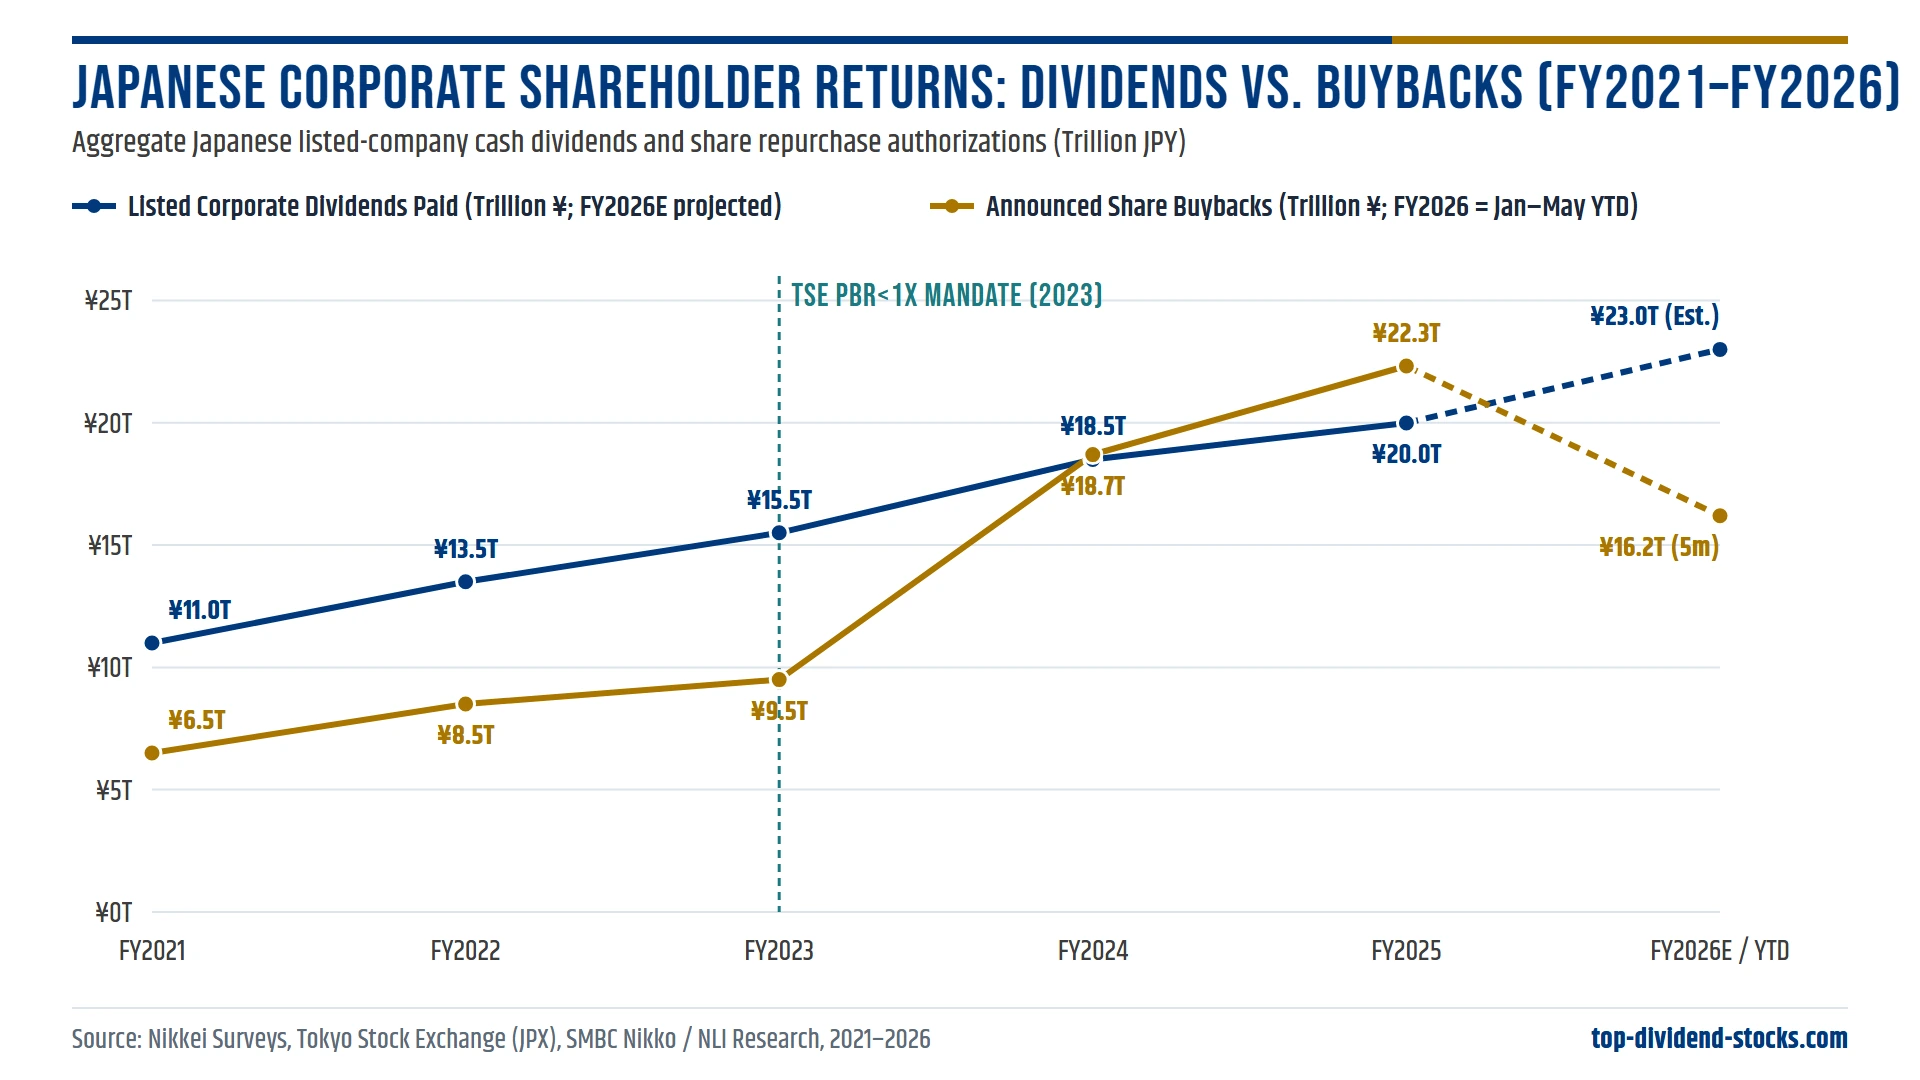
Figure 2 captures the speed of that structural break. Annual Japanese dividends roughly doubled from ~¥11.0 trillion in FY2021 to ¥19.99 trillion in FY2025 and an estimated ¥23 trillion in FY2026. Even more striking, share buybacks—which hovered at ¥6.5 to ¥9.5 trillion prior to the TSE mandate—exploded past ¥18.7 trillion in FY2024 and hit ¥22.32 trillion in FY2025, surpassing total cash dividends for the first time.
Cross-Shareholding Unwinds and DOE Floors: Why Japanese Buybacks Differ
American income analysts often view corporate share buybacks skeptically because tech firms frequently repurchase shares merely to offset executive stock-based compensation—a dilution test we applied in our analysis of NVIDIA’s $235 billion buyback program. Japanese buybacks operate under different balance-sheet mechanics.
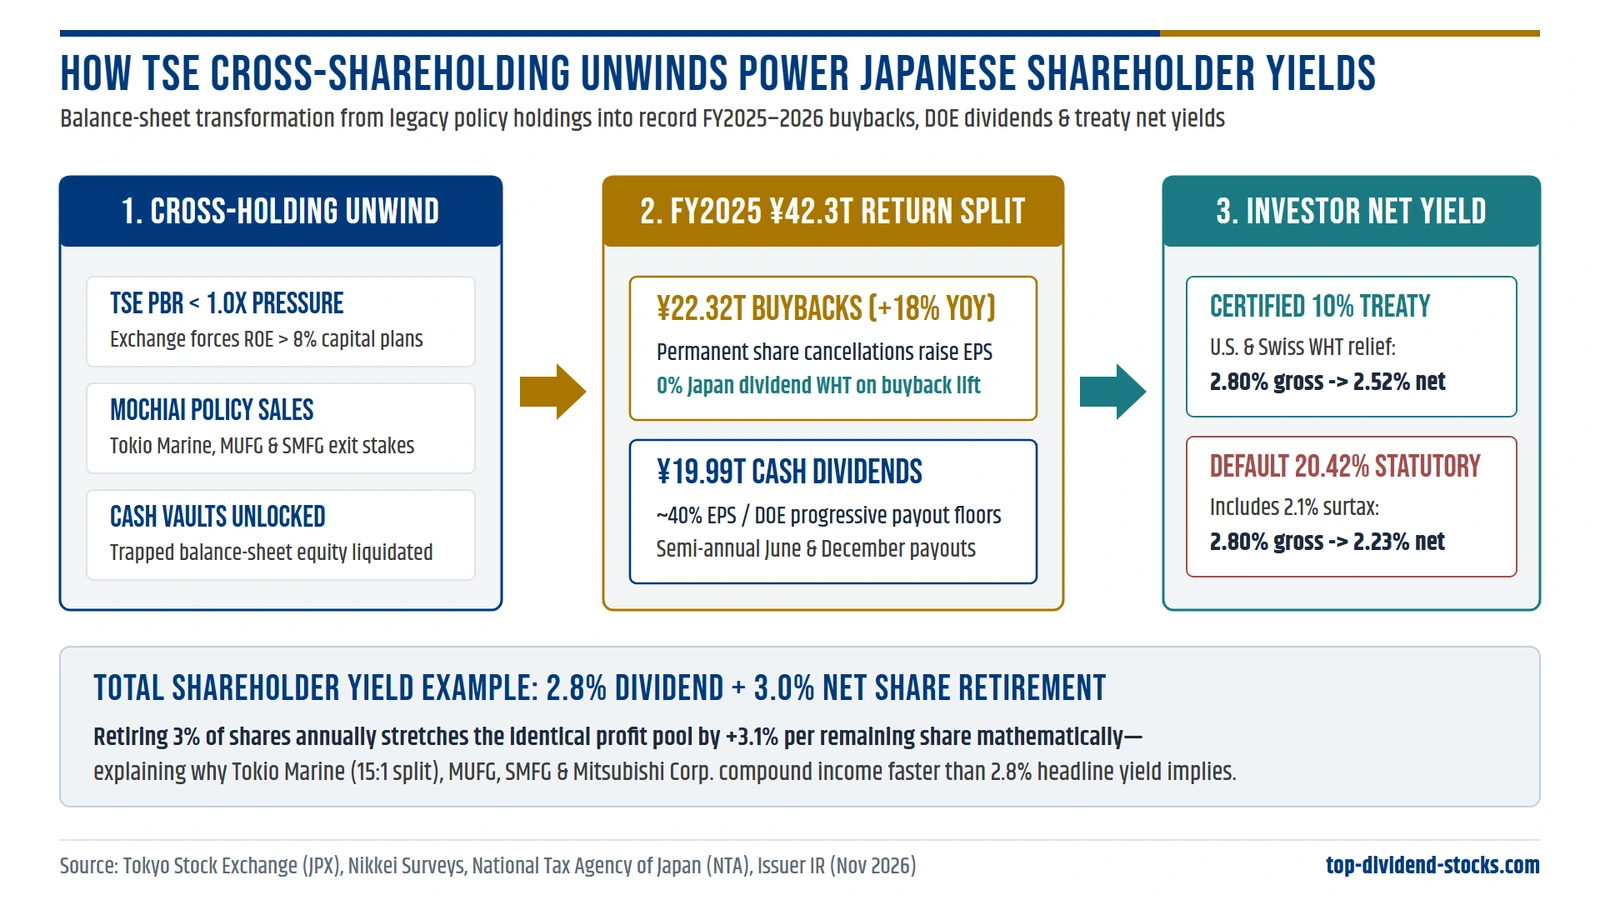
For generations, Japanese banks, insurers, and manufacturers held vast blocks of one another’s equity as “policy shareholdings” (mochiai) to cement supplier ties and block hostile takeovers. Under regulatory pressure from Japan’s Financial Services Agency and the TSE, insurers like Tokio Marine Holdings and mega-banks like MUFG and SMFG have committed to liquidating policy shareholdings down toward zero. When Tokio Marine sells hundreds of billions of yen in non-core client stock, it unlocks trapped balance-sheet equity and funnels the cash straight into treasury share cancellations and overseas specialty acquisitions—driving ROE toward 22%.
A second hallmark of modern Japanese dividend policy is the adoption of Dividend on Equity (DOE) and progressive payout floors alongside traditional EPS payout targets. Trading houses like Mitsubishi Corporation—famous among global value investors since Berkshire Hathaway accumulated stakes across the five Sogo Shosha—combine a roughly 40%+ total payout orientation with progressive dividend pledges that shield income from single-year commodity swings. Similarly, MUFG and SMFG anchor around ~40% consolidated payout frameworks paired with multi-hundred-billion-yen annual share repurchases.
Total Shareholder Yield Arithmetic: Cash Dividends Plus Share Cancellations
Income investors trained exclusively on North American or European yield screens frequently underestimate Japanese dividend stocks because they inspect only the 2.3%–3.3% upfront cash yield. When aggregate corporate buybacks reach ¥22.32 trillion annually—exceeding ¥19.99 trillion in aggregate cash dividends—the mechanics of share cancellation alter per-share compounding dramatically.
Suppose a TSE Prime financial group generates steady ¥1 trillion in net profit, pays out 40% (¥400 billion) as cash dividends representing a 2.8% cash yield, and deploys proceeds from policy-shareholding liquidations to repurchase and retire 3.0% of outstanding shares over the fiscal year. Even with zero organic profit growth, the exact same ¥400 billion dividend pool spread across 3.0% fewer shares raises next year’s per-share dividend by roughly +3.1% mathematically before any underlying earnings expansion. Just as important for international holders, Japan levies its 10%–20.42% dividend withholding tax solely on cash dividends declared—meaning capital returned via genuine share-count cancellation compounds inside share price free of annual foreign withholding tax drag.
Six TSE Prime Dividend Leaders Compared: Yield, Payout Policy & After-Tax Cash
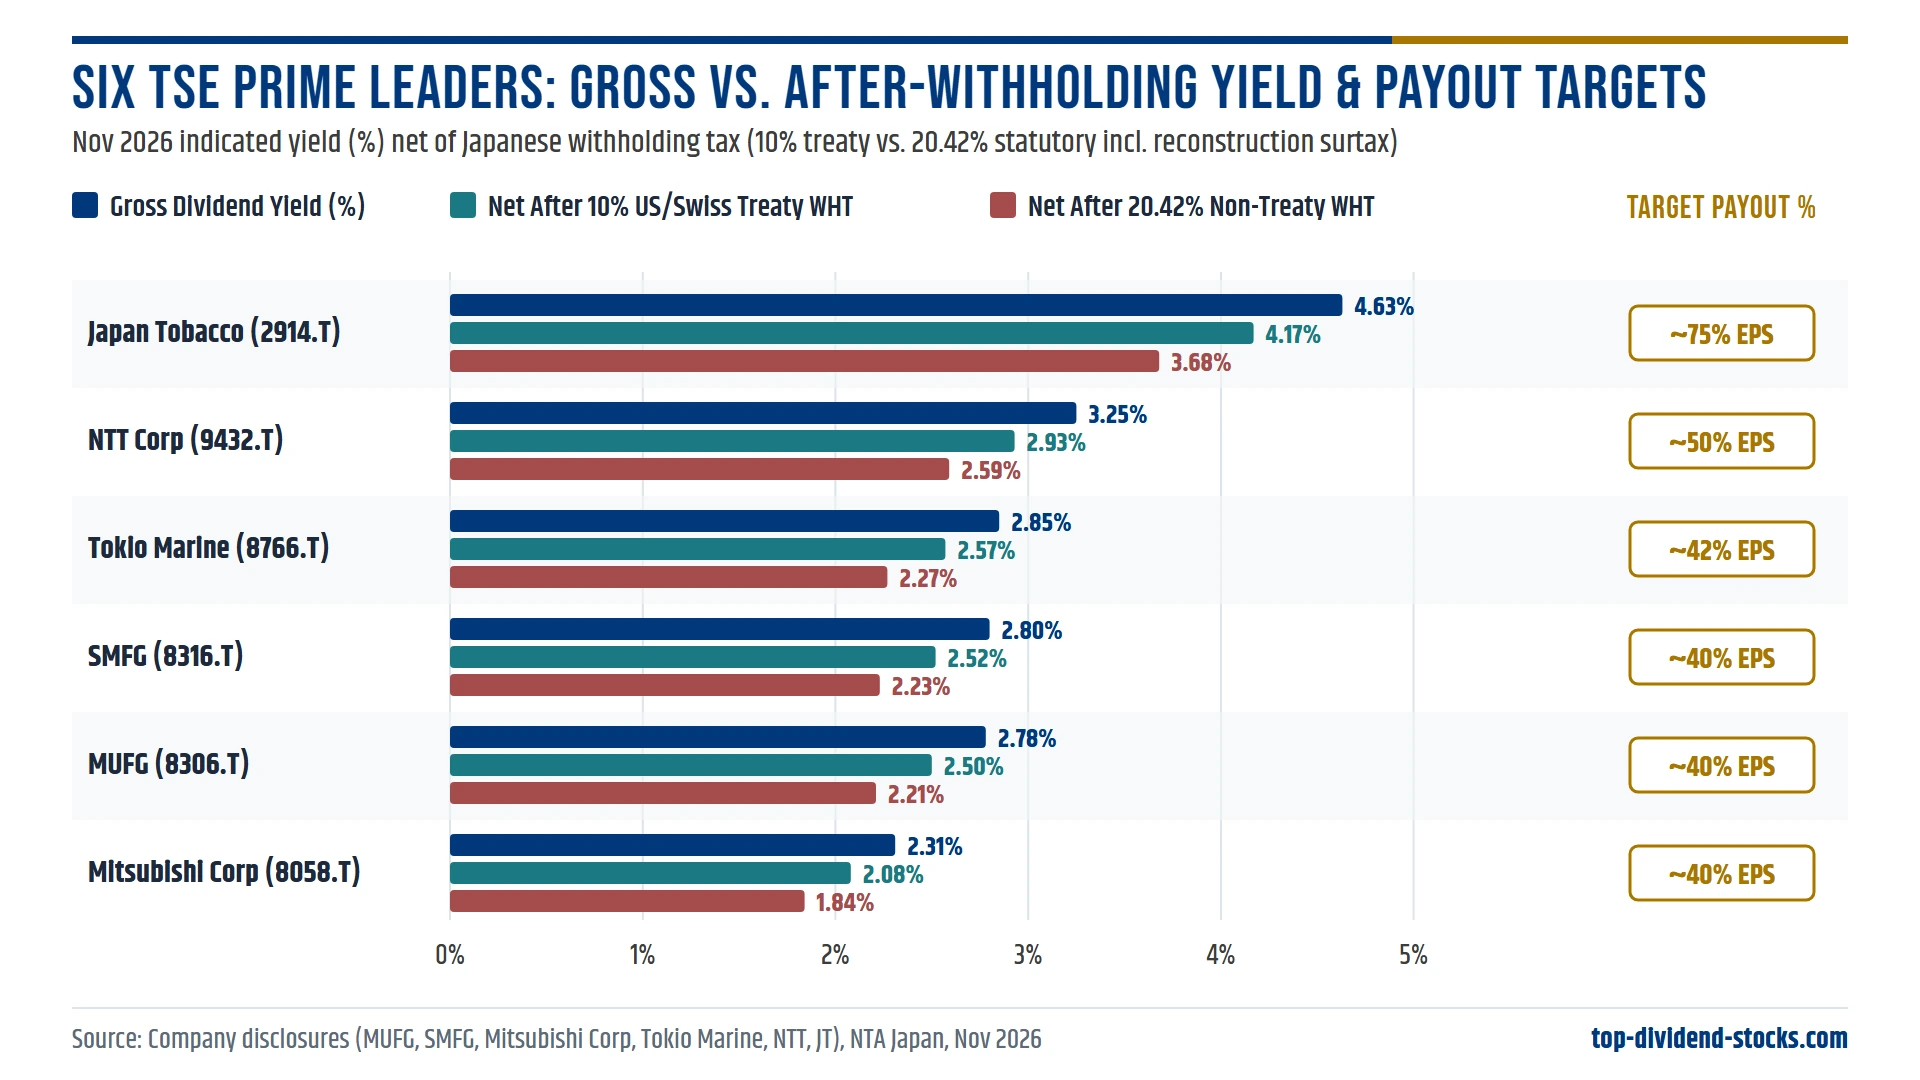
To see how the TSE reform translates into investable income today, examine six bellwether TSE Prime dividend leaders across banking, general trading, insurance, telecoms, and consumer staples as of November 2026. Notice that headline yields sit largely between 2.3% and 4.6%—moderate at first glance, yet backed by conservative payout ratios and multi-trillion-yen buyback tailwinds.
| Ticker (TSE) | Company | Sector | Nov 2026 Price (JPY) | Annual Div. (JPY) | Gross Yield | Payout Target / Ratio | Approx. PBR / ROE |
|---|---|---|---|---|---|---|---|
| 8306.T | Mitsubishi UFJ Financial (MUFG) | Mega-Bank | ~¥3,475 | ¥96–¥101 | ~2.78% | ~40% target (~55% trail.) | PBR ~1.63x · ROE ~9%–12% |
| 8316.T | Sumitomo Mitsui Financial (SMFG) | Mega-Bank | ~¥3,268 | ¥100* (post-split) | ~2.80% | ~40% progressive target | PBR ~0.9x–1.1x · ROE ~9% |
| 8058.T | Mitsubishi Corp. | Sogo Shosha | ~¥5,405 | ¥125 (¥62+¥63) | ~2.31% | ~35%–40%+ total + DOE | PBR ~1.3x–1.5x · ROE ~10%–13% |
| 8766.T | Tokio Marine Holdings | Specialty Insurance | ~¥597 (15:1 split) | ~¥16.34 | ~2.85% | ~40%–45% adj. earnings | PBR ~1.2x–2.2x · ROE ~22% |
| 9432.T | NTT Corp. | Telecoms | ~¥166 | ¥5.40 | ~3.25% | ~50%+ steady hike streak | PBR ~1.3x–1.5x · ROE ~9% |
| 2914.T | Japan Tobacco (JT) | Consumer / Tobacco | ~¥5,860 | ¥272 | ~4.63% | ~75% target payout | PBR ~2.1x–2.3x · ROE ~15%–20% |
Standout Structural Nuances Inside the Six Leaders
- Tokio Marine’s accessibility shift: High Japanese minimum trading lot rules (100 shares per board lot) historically priced small retail investors out of top blue chips. Tokio Marine’s late-2026 15-for-1 stock split brought a 100-share lot down near ¥59,700 (~$400 USD equivalent depending on JPY spot), matching NTT’s accessible ¥16,600 lot size.
- MUFG & SMFG vs. European banks: While several European insurers and banks pay higher upfront yields (4.5%–6.5%), MUFG and SMFG pair 2.8% dividends with active balance-sheet rate leverage and recurring share cancellations—already lifting MUFG above 1.6x PBR while SMFG remains near book value.
- Japan Tobacco’s higher-yield trade-off: At ~4.63% gross yield and a ~75% target payout ratio, JT acts as Japan’s classic high-yield anchor, though investors must discount heightened headline volatility tied to its Russian operations and slower domestic cigarette volume.
- Mitsubishi Corp.’s progressive floor: Trading houses tie total returns to global energy, metals, and industrial distribution cash flows, using progressive dividend floors plus opportunistic buybacks rather than risking payout cuts during cyclical commodity dips.
Three Distinct Dividend Archetypes on the Tokyo Stock Exchange
Constructing a balanced Japanese equity income sleeve starts with separating Tokyo dividend payers into three distinct functional buckets rather than buying strictly on highest yield:
- Rate-Normalization & Asset-Unwind Financials (MUFG, SMFG, Tokio Marine): These institutions benefit doubly from higher Japanese government bond yields widening net interest margins and decades-old cross-shareholding sales funding multi-year share retirements. Conservative ~40% earnings payout ratios keep dividend hikes resilient even during credit-cycle wobbles.
- Progressive DOE Capital Compounders (Mitsubishi Corp.): By anchoring shareholder returns around Dividend-on-Equity floors and progressive payout commitments, major trading conglomerates convert global LNG, industrial distribution, and metals cash flows into steady rising yen payouts rather than erratic commodity special dividends.
- Defensive Cash-Yield Anchors (NTT Corp., Japan Tobacco): Domestic telecommunications and regulated consumer franchises pay higher starting yields (3.25% to 4.63%) with lower top-line volatility, serving income investors who want immediate spendable yen cash flow—provided investors watch NTT’s capital intensity and Japan Tobacco’s elevated ~75% payout ceiling.
What Income Investors Miss: Withholding Tax, Semi-Annual Lumps & Yen Risk
Before rotating capital into Tokyo equities, non-Japanese investors must navigate three operational realities that rarely show up in global index newsletters—echoing the same cross-border net-yield discipline highlighted in our 2026 global dividend outlook.
1. 20.42% Statutory Withholding vs. 10%–15% Treaty Relief
Japan imposes a statutory non-resident dividend withholding tax of 20.42% on portfolio shareholdings (20% base income tax plus a 2.1% Special Reconstruction Surtax scheduled through 2037). Resident Japanese investors enjoy 15.315% national + 5% inhabitant tax on listed shares—or 0% tax inside a NISA account—whereas foreign individuals living in the U.S., Switzerland, or Europe are ineligible for NISA.
Fortunately, Japan’s bilateral double-taxation treaties slash that 20.42% haircut substantially when your broker properly processes relief-at-source or treaty documentation:
- U.S. Tax Residents: Under the U.S.–Japan Tax Treaty, portfolio dividend withholding drops to 10% (preserving 90% of gross dividends, often eligible for foreign tax credits on Form 1116).
- Swiss Tax Residents: Under the updated Switzerland–Japan Tax Treaty protocol, portfolio dividends generally cap at 10% (0% for ≥10% qualifying corporate stakes held 365 days), leaving a 2.80% gross yield at 2.52% net before Swiss cantonal/federal tax credits.
- EU & UK Investors: Treaty rates apply bilaterally—typically capping portfolio withholding at 10% (e.g., UK, France under qualifying rules) or 15% (e.g., Germany, Netherlands)—though some discount European brokers still default to 15.315% or 20.42% unless Japan relief-at-source is supported. Verify exact broker handling via our dividend withholding tax matrix.
Consider what that custody distinction costs on a hypothetical $100,000 portfolio yielding 2.80% gross ($2,800 USD-equivalent annual dividends). Through a broker applying 10% U.S. or Swiss treaty relief at source, withholding deducts $280 and leaves $2,520 net cash (2.52%). Through an uncertified broker defaulting to Japan’s 20.42% statutory rate, withholding takes $571.76 and drops net cash to $2,228.24 (2.23%)—wasting nearly 30 basis points of spendable yield every year until reclaimed. Always check whether an ADR wrapper imposes annual depositary pass-through fees (often $0.01–$0.03 per share) compared with direct Tokyo 100-share lot ownership at multi-currency brokers.
2. Semi-Annual Fiscal Year-End Clustering & 100-Share Board Lots
Unlike U.S. quarterly payers that stagger payments across January/February/March cycles, the vast majority of TSE Prime corporations run March 31 fiscal years and pay dividends only twice annually: an interim dividend around November/December (ex-date late September) and a final dividend in June (ex-date late March). Building monthly cash flow exclusively from individual Japanese shares is therefore impractical—though pairing Japan’s June/December payout peaks with U.S. quarterly payers paying in January/April/July/October smooths annual household cash flow naturally. Remember also that Tokyo Stock Exchange shares trade in 100-share board lots on direct exchanges; international investors seeking smaller position sizes can use ADR wrappers (such as MUFG or SMFG NYSE ADRs, which also fall under U.S. or Japanese tax checks depending on brokerage) or broad global dividend ETFs.
3. Yen Translation Volatility vs. Local Purchasing Power
Even a 10% annual dividend hike in Japanese yen disappears temporarily in USD, EUR, or CHF terms if the yen weakens by 12% during Bank of Japan rate-normalization pauses. Conversely, unhedged Japanese equities provide natural currency diversification if U.S. fiscal deficits soften the dollar over a full cycle. Match currency exposure to your spending horizon rather than chasing yen yields unhedged for short-term cash bills.
How to Access Japanese Dividends: Direct TSE Equities vs. Global ETFs
Direct TSE Prime Stocks (100-Share Lots / ADRs)
- Best for: Investors targeting total shareholder yield (2.5%–3.3% dividend + aggressive buyback cancellations) at brokers offering direct Tokyo access (such as Interactive Brokers).
- Core shortlist: Pair MUFG or SMFG (rate/credit beta) with Mitsubishi Corp. (progressive DOE) and Tokio Marine (post-split accessibility, ~22% ROE).
- Key check: Confirm 10%–15% treaty WHT relief-at-source before buying; otherwise 20.42% WHT erodes net yield.
Global & UCITS Dividend ETF Wrappers
- Best for: Investors under $100k who want diversified Japan weightings (typically 6%–10% inside global developed high-yield funds) without tracking 100-share yen board lots or semi-annual ex-dates.
- Key vehicles: Compare global UCITS sleeves like VHYL or TDIV in our European UCITS ETF guide.
- Trade-off: Fund-level diversification dilutes pure exposure to Japan’s sub-1x PBR corporate restructuring wave.
Practical Checklist Before Allocating Capital to Tokyo
Corporate Japan’s transformation from cash hoarding to disciplined capital return represents one of the cleanest structural governance tailwinds in global equity markets. Treat Japanese dividend payers as a distinct total-yield sleeve using three operational rules:
- Screen for Total Shareholder Yield, not dividend yield alone: Add recurring share-cancellation pace to the 2.3%–3.3% cash dividend—favoring firms unwinding cross-shareholdings rather than issuing convertible debt.
- Verify explicit DOE or progressive payout floors: Prioritize management teams with published medium-term ROE (>8%–10%) and progressive dividend commitments (MUFG, SMFG, Mitsubishi Corp., and Tokio Marine).
- Verify treaty rate before settlement: Confirm your broker applies the 10% (U.S./Switzerland) or 10%–15% bilateral treaty rate at source rather than the 20.42% statutory default, and expect semi-annual June/December cash clustering.
Methodology, Split Adjustments, and Withholding Tax Calculations
Share prices, annualized dividends, PBR, and ROE snapshots reflect November 2026 TSE Prime trading ranges. Tokio Marine Holdings (8766.T) per-share price (~¥597) and annualized dividend (~¥16.34) reflect its late-2026 15-for-1 stock split.
Aggregate dividend and share buyback trends combine Nikkei corporate surveys, Tokyo Stock Exchange (JPX) disclosures, and SMBC Nikko / NLI Research aggregates across March-fiscal listed Japanese firms. FY2026 dividends (~¥23T) reflect Nikkei survey consensus projections; Jan–May 2026 buybacks (¥16.2T) reflect actual five-month calendar authorizations.
Primary Sources and Institutional References
- Japan Exchange Group / Tokyo Stock Exchange (JPX) — Action to Implement Management that is Conscious of Cost of Capital and Stock Price (PBR < 1x reform guidelines).
- Mitsubishi UFJ Financial Group (MUFG) IR & SMFG Investor Relations — FY2026 medium-term payout targets (~40%), dividend forecasts, and buyback authorizations.
- Mitsubishi Corporation IR & Tokio Marine Holdings IR — Progressive dividend / DOE frameworks, policy-shareholding reductions, and 15-for-1 split details.
- NTT Group Investor Relations — Consecutive dividend growth history and FY2026 guidance.
- National Tax Agency of Japan (NTA) — 20.42% non-resident withholding rate including 2.1% Special Reconstruction Surtax (effective through 2037) and bilateral treaty frameworks.