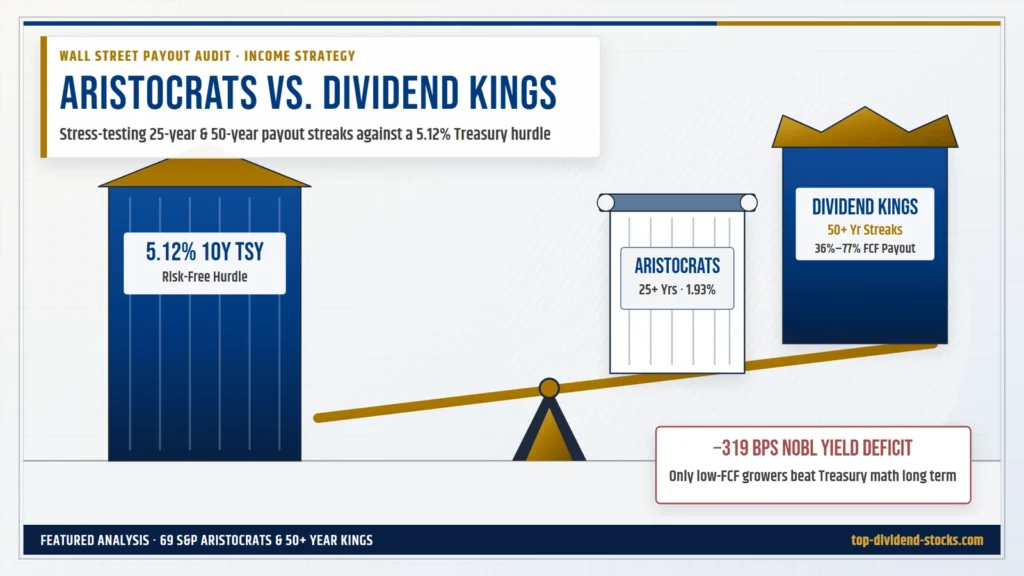
A 25-year or 50-year dividend increase streak used to double as a shorthand for safety and competitive income. By mid-November 2026, that shorthand solves only half of an income investor’s problem. With the benchmark 10-year U.S. Treasury yield hovering near 5.12% and the Federal Reserve holding its policy range at 3.75%–4.00% ahead of a widely priced December hike, risk-free sovereign paper pays more than twice the income of almost every multi-decade U.S. dividend grower.
Look at the spread compression at the index level. The ProShares S&P 500 Dividend Aristocrats ETF (NOBL) yields roughly 1.93% net of its 0.35% expense ratio in November 2026, while the broader S&P 500 index yields just 1.08%. Even before personal income taxes or cross-border withholding, an Aristocrats tracker trails a 10-year Treasury note by 319 basis points—a negative income spread that forces equity investors to rely far more heavily on dividend growth rates and free cash flow durability than on starting yield.
Meanwhile, S&P Dow Jones Indices’ annual February 2026 rebalancing left the S&P 500 Dividend Aristocrats roster unchanged at a record 69 constituent companies, with zero additions and zero removals. Stability on the surface hides wide divergence underneath: free cash flow (FCF) payout ratios across famous 50-year Dividend Kings now span from under 40% at industrial compounders to more than 75% at mature beverage and aftermarket auto-parts franchises. Comparing Dividend Aristocrats vs. Dividend Kings in late 2026 therefore requires auditing cash conversion, refinancing exposure, and yield-on-cost crossover math—not simply counting calendar streaks.
Executive Summary: Aristocrats vs. Kings Audit (November 2026)
- Streak rules diverge structurally: The S&P 500 Dividend Aristocrats index holds 69 large-cap members requiring 25+ years of dividend hikes, S&P 500 inclusion, and $3B+ float-adjusted market cap. Dividend Kings require 50+ consecutive years of hikes with no index or size restriction (roughly 56–60 U.S.-listed firms, led by American States Water at 72 years).
- Negative yield spread persists: Against a 5.12% 10-year Treasury yield, NOBL’s 1.93% yield represents a −319 bps starting income deficit. At a 6% annual dividend growth rate, a 2.5% starting equity yield still takes 12.3 years to catch a flat 5.12% nominal coupon on cash yield alone.
- GAAP payout ratios distort safety: Acquired IPR&D charges skew AbbVie’s GAAP payout above 118% even though its FCF payout sits near 68%, while depreciation makes Realty Income’s GAAP payout exceed 180% despite healthy ~75% AFFO coverage.
- Mature Kings face margin tightening: Coca-Cola (~77% FCF payout) and Genuine Parts (~76% FCF payout) leave less reinvestment buffer than ExxonMobil (~44%), Lowe’s (~41%), or Dover (~36% FCF payout) in a slower-volume, higher-rate backdrop.
Rulebook Mechanics: 25 Years in the S&P 500 vs. 50 Years Anywhere
Investors frequently treat Dividend Kings as a straightforward subset of Dividend Aristocrats, assuming every 50-year payer automatically sits inside the S&P 500 Dividend Aristocrats Index. That assumption fails because the two labels measure different institutional universes.
The S&P 500 Dividend Aristocrats Index is a rules-based benchmark maintained by S&P Dow Jones Indices. To qualify at each annual reconstitution, a company must belong to the S&P 500, have increased regular annual per-share dividends for at least 25 consecutive years, meet minimum float-adjusted market capitalization thresholds (typically $3 billion) and liquidity screens, and operate in a sector balanced by S&P’s index committee rules. Crucially, the index is equal-weighted and rebalanced quarterly—putting a roughly 1.4% cap-neutral weight on every member from Procter & Gamble to smaller industrial constituents.
By contrast, Dividend Kings is an informal market designation tracked by dividend research databases rather than a single trademarked S&P index. Its sole quantitative hurdle is 50 or more consecutive years of annual dividend increases. Because S&P 500 membership is not required, roughly a third of the 56 to 60 Dividend Kings are mid-cap or small-cap specialists—most notably regulated water utility American States Water (AWR), which leads U.S. corporate history at 72 consecutive annual raises despite an equity market value far smaller than mega-cap Aristocrats.
Why does that index distinction matter in portfolio construction? First, S&P 500 membership introduces a hidden survival filter: if a company’s market capitalization shrinks below S&P 500 eligibility during a prolonged structural downturn, it is dropped from the Aristocrats index even if management preserves its dividend streak. Second, equal-weighting inside NOBL dampens sector concentration compared with market-cap-weighted benchmarks, yet still leaves the Aristocrats heavily tilted toward Industrials, Consumer Staples, and Financials—sectors whose valuation multiples and margin stability react sharply to elevated borrowing costs. For readers building a diversified core income allocation, understanding how these index rules compare with broader sector-screened dividend stocks and quality-screened ETFs such as SCHD and VIG prevents unintended style overlap.
The Yield-Gap Inversion: Competing Against a 5.12% Treasury Benchmark
Between 2010 and 2021, dividend growth investors enjoyed a rare structural tailwind: zero-interest-rate policy compressed 10-year U.S. Treasury yields to an annual average of 1.45% in 2021 (and a pandemic trough of 0.89% in 2020), allowing even modest 1.8% to 2.5% equity dividend yields to match or beat sovereign bond coupons while delivering inflation-protected growth on top. That regime inverted decisively after 2022 and hardened through 2026.
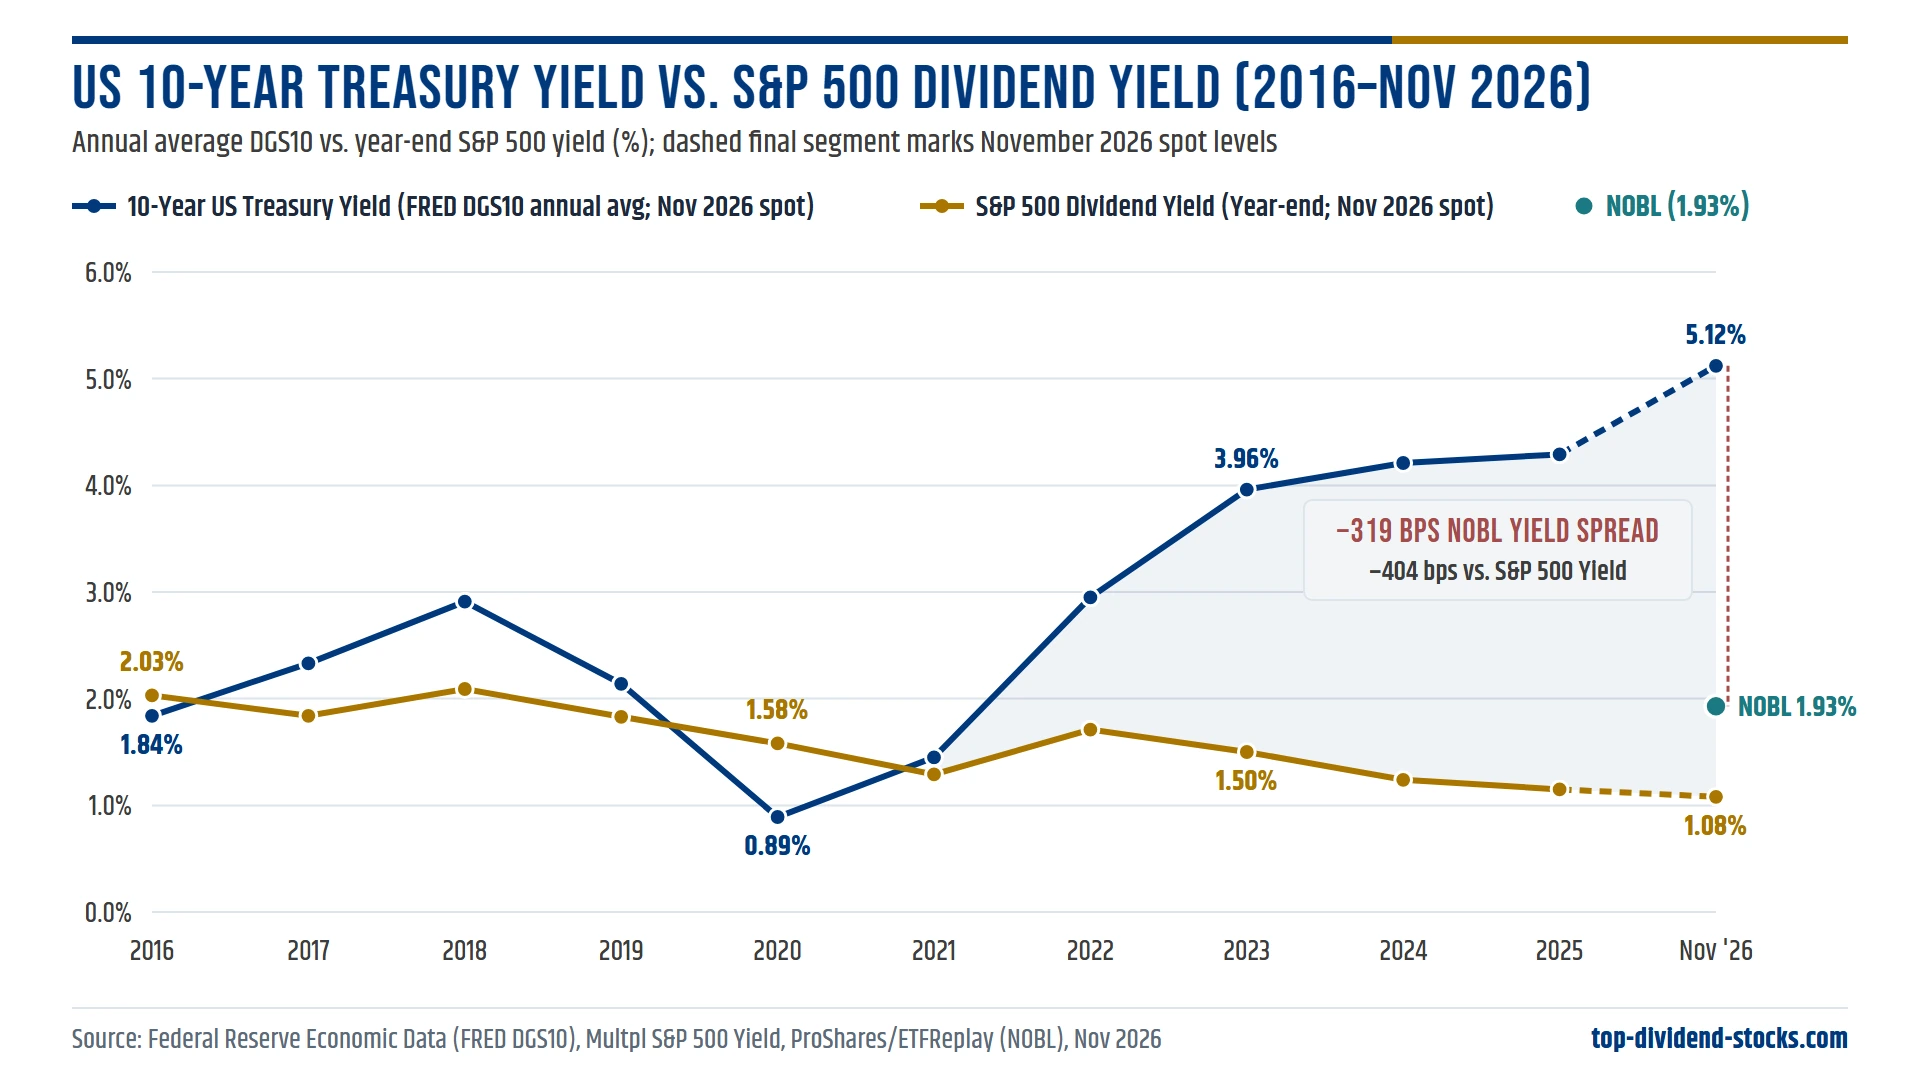
As Figure 1 illustrates, the spread between the 10-year Treasury yield and S&P 500 equity dividend income swung from roughly +69 basis points in favor of stocks during 2020 to −404 basis points against the broad index by November 2026. Even equal-weighted Aristocrats via NOBL sit 319 basis points below risk-free 10-year Treasury coupons. That gap alters the economic hurdle for every dividend growth stock: when safe cash and medium-duration Treasuries pay 4% to 5.1%, investors can no longer justify buying a low-yielding compounder merely because it raised its payout by 3% annually.
The Yield-on-Cost Crossover Arithmetic
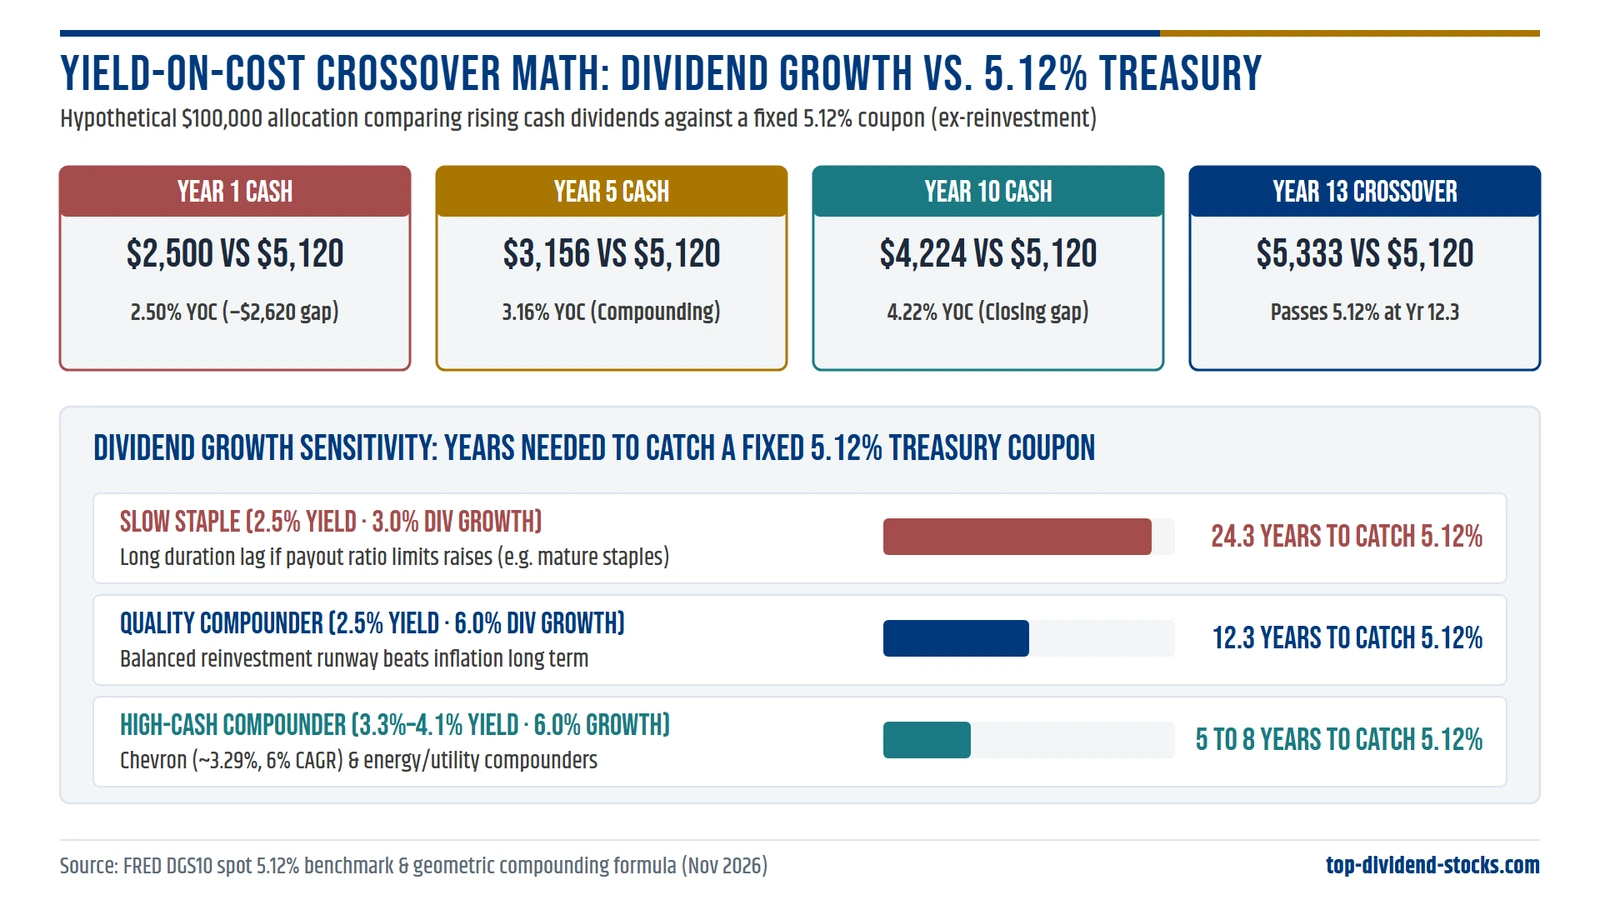
Before dismissing a 2.4%–2.7% Dividend King in favor of a 5.12% Treasury note, run the exact compounding math. Suppose an investor allocates $100,000 into a high-grade payer yielding 2.50% ($2,500 initial annual income) whose board compounds the dividend at 6.0% per year, compared with $100,000 locked into a flat 5.12% 10-year note ($5,120 fixed coupon). Ignoring share-price appreciation and dividend reinvestment:
- Year 1 cash income: Equity $2,500 vs. Treasury $5,120 (−$2,620 annual deficit).
- Year 5 cash income: Equity $3,156 (3.16% yield on original cost) vs. Treasury $5,120.
- Year 10 cash income: Equity $4,224 (4.22% yield on cost) vs. Treasury $5,120.
- Crossover point: Annual cash income equalizes in Year 13 ($5,030 in Year 12.3 equivalent; $5,333 in Year 13), while cumulative nominal cash received does not pull even until well past Year 20 unless dividends are reinvested.
Drop that dividend growth rate from 6.0% to 3.0%—closer to what several mature staples have delivered recently—and the crossover horizon blows past 24 years. Conversely, if a stock starts near 3.3%–4.1% (such as Chevron or PepsiCo) and grows its payout by 5%–7%, crossover arrives inside 5 to 9 years—provided the underlying business actually generates enough free cash flow to sustain those increases without borrowing. For a complementary perspective on how rate duration hits higher-yielding sleeves like REITs and preferreds, see our 2026 dividend-duration stress test.
Free Cash Flow vs. Accounting Illusions: Auditing Payout Durability
Headline earnings payout ratios are a blunt screening tool that routinely generate false positives and false negatives across Dividend Aristocrats and Kings. Three accounting distortions explain why serious income analysts anchor on free cash flow (FCF) payout ratios—or Adjusted Funds From Operations (AFFO) for real estate—before trusting any multi-decade streak.
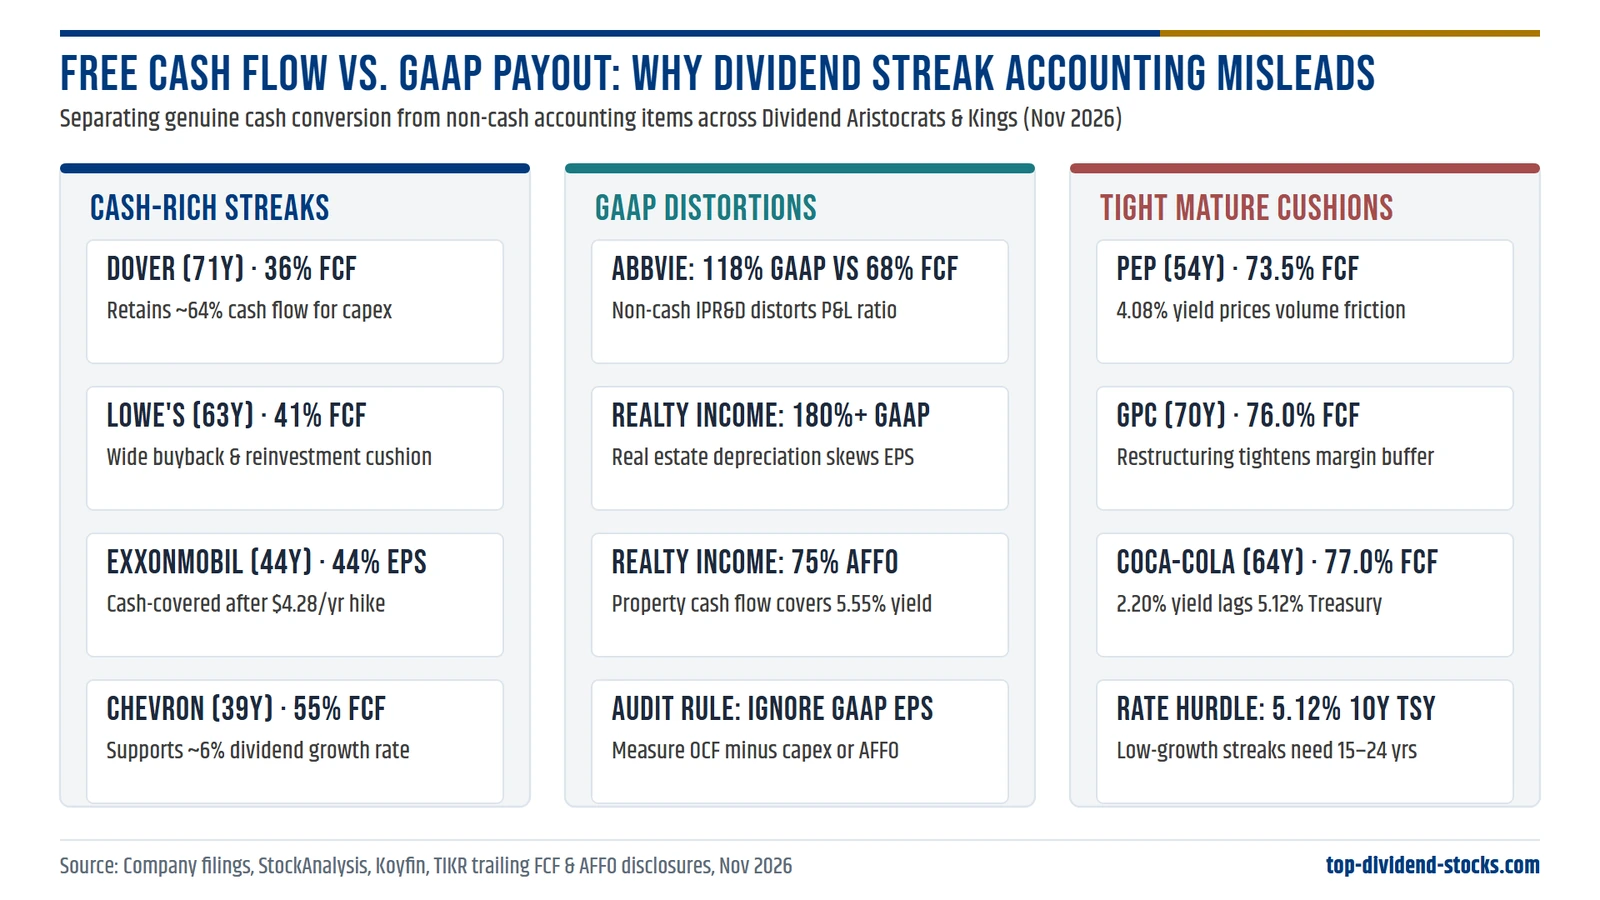
First, pharmaceutical acquisition charges can make a rock-solid cash generator appear distressed on a GAAP P&L. AbbVie (ABBV), carrying a 53-year streak incorporating its Abbott Laboratories heritage and a $7.28 annualized dividend (roughly 2.47% yield after its October 2026 increase to $1.82 per quarter), shows a trailing GAAP earnings payout ratio north of 118% due to acquired in-process R&D (IPR&D) and milestone write-offs. Strip away non-cash acquisition accounting and evaluate cash flow directly: on roughly $18.8 billion in annual free cash flow, AbbVie’s FCF payout ratio sits near 68%—elevated enough to keep dividend growth around 6.3% rather than double digits, yet fully cash-covered.
Second, real estate depreciation renders standard net-income payout ratios meaningless for REIT Aristocrats. Realty Income (O), which pushed its consecutive annual dividend streak to 32 years (and 117 consecutive quarterly increases) with a November 2026 hike to $0.274 per month ($3.288 annualized, ~5.55% yield), screens above 180%–220% on GAAP earnings payout because property depreciation depresses net income. Measured properly against AFFO, Realty Income’s distribution consumes roughly 75% of recurring property cash flow—in line with conservative net-lease standards explored in our 2026 high-dividend REIT ranking.
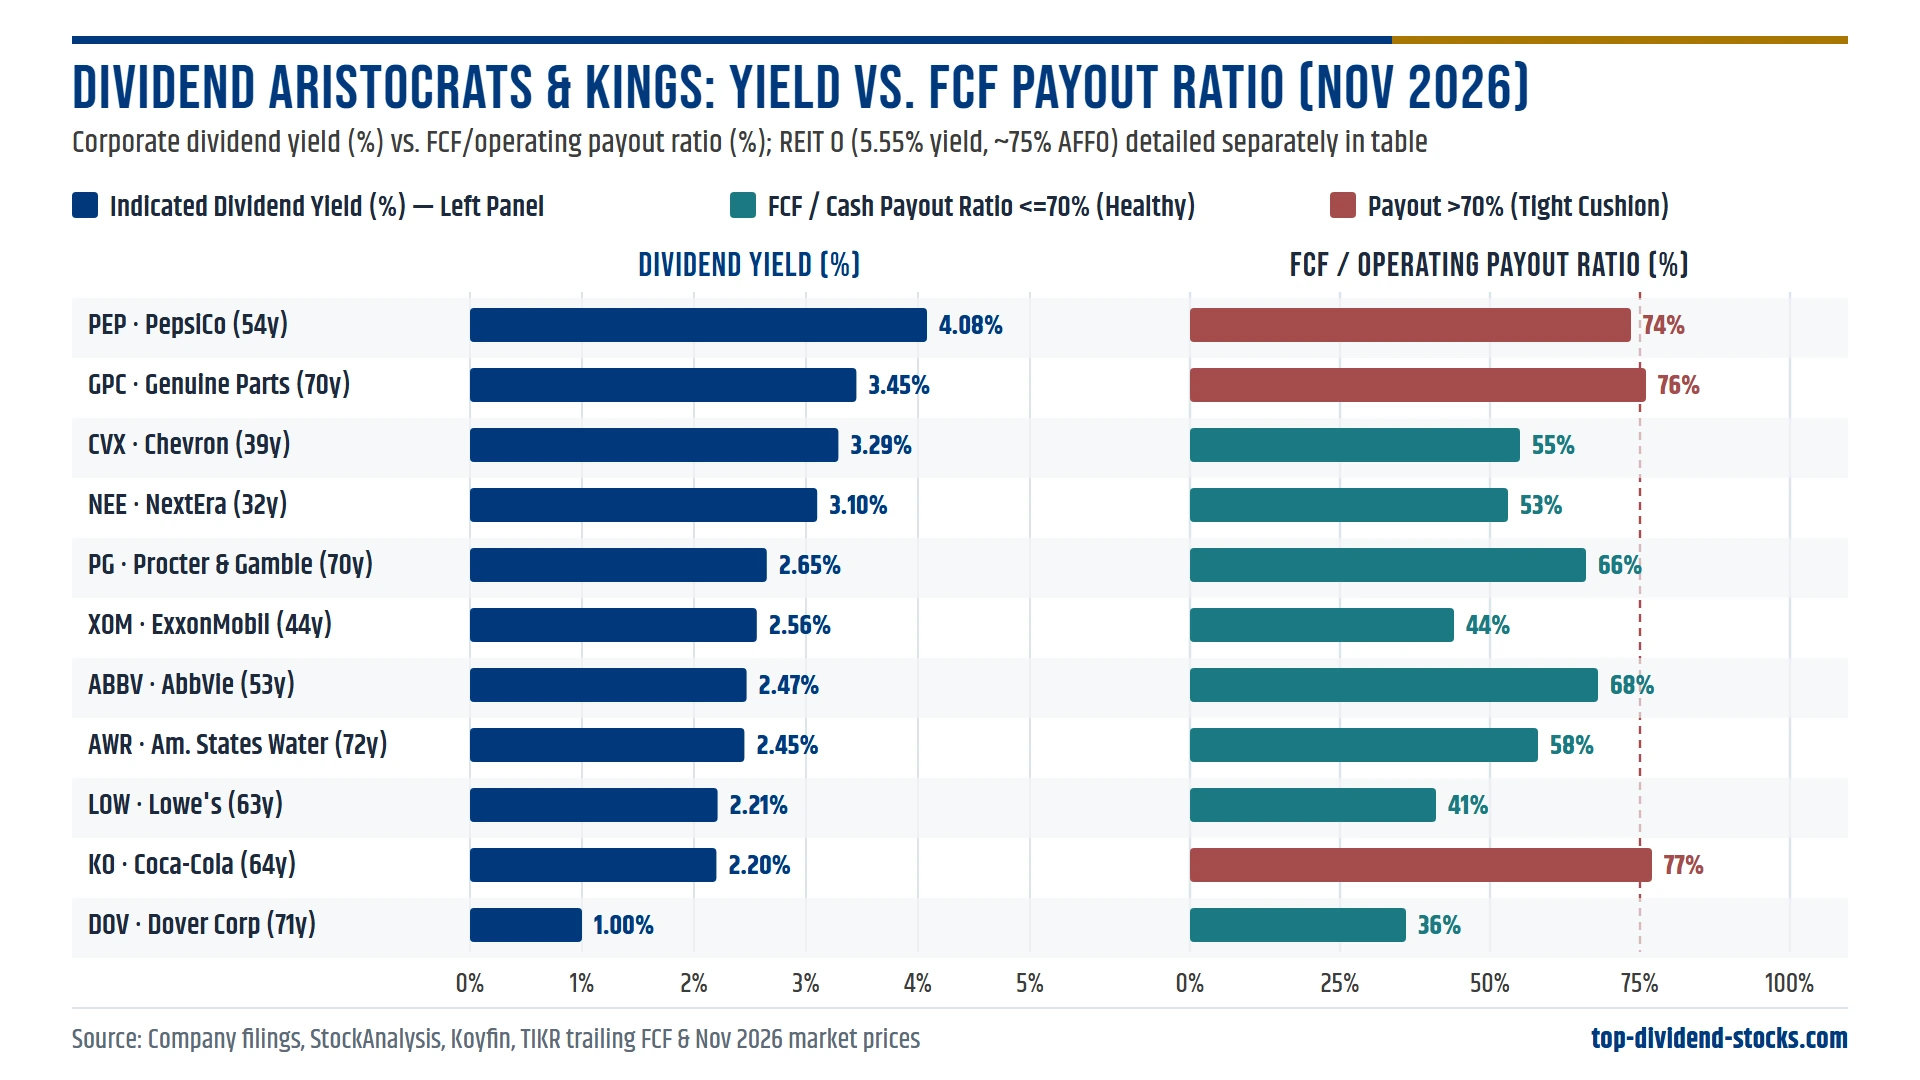
Third, working-capital swings and capex cycles expose mature Dividend Kings that look pristine on historical streak charts. Coca-Cola (KO) boasts 64 consecutive annual increases and a $2.12 annual dividend (~2.20% yield), yet trailing FCF payout sits near 75%–79% once tax settlements and capital investments are deducted. Genuine Parts (GPC), one of the world’s longest-running Dividend Kings at 70 years (~3.45% yield), has seen non-recurring restructuring and freight cost pressures pull its FCF payout up near 76%. Compare that with Lowe’s (LOW) at ~41% or ExxonMobil (XOM)—which raised its quarterly dividend to $1.07 ($4.28 annualized) in November 2026 while keeping earnings payout near 42%–45%—or industrial King Dover (DOV) at roughly 36% of FCF.
Fourteen Flagship Aristocrats and Kings Stress-Tested Side by Side
Evaluating individual constituents requires separating streak longevity from capital efficiency. The table below compiles verified November 2026 share prices, annualized payouts, consecutive streak lengths, FCF or operating payout coverage, and five-year dividend compound annual growth rates across fourteen bellwether Aristocrats and Kings spanning staples, healthcare, energy, utilities, industrials, retail, and net-lease real estate.
| Ticker | Company | Cohort (Streak) | Nov 2026 Price | Annual Div. | Yield | FCF / Cash Payout | 5Y Div. CAGR |
|---|---|---|---|---|---|---|---|
| AWR | American States Water | King (72 yrs) | ~$88.80 | $2.18 | 2.45% | ~58% (earnings/reg.) | ~8.0% |
| DOV | Dover Corporation | King (71 yrs) | ~$209.50 | $2.10 | ~1.00% | ~36% FCF (~24% EPS) | ~2.0% |
| PG | Procter & Gamble | King (70 yrs) | ~$164.00 | $4.35 | 2.65% | ~65%–67% FCF | ~5.6% |
| GPC | Genuine Parts Co. | King (70 yrs) | Late-2026 adj. | $4.26* | ~3.45% | ~76% FCF | ~5.4% |
| KO | Coca-Cola Co. | King (64 yrs) | ~$96.40 | $2.12 | 2.20% | ~75%–79% FCF | ~4.6% |
| JNJ | Johnson & Johnson | King (64 yrs) | ~$274.00 | $5.36 | 1.96% | ~70%–75% FCF | ~5.3% |
| CL | Colgate-Palmolive | King (63 yrs) | ~$96.00 | $2.12 | 2.21% | ~55%–60% cash | ~3.5% |
| LOW | Lowe’s Companies | King (63 yrs) | ~$226.10 | $5.00 | 2.21% | ~41% earnings/FCF | ~10%+ hist. |
| PEP | PepsiCo Inc. | King (54 yrs) | ~$145.00 | $5.92 | 4.08% | ~72%–75% FCF | ~7.0% |
| ABBV | AbbVie Inc. | King (53 yrs) | ~$294.55 | $7.28 | 2.47% | ~68% FCF (GAAP >118%) | ~6.3% |
| XOM | ExxonMobil Corp. | Aristocrat (44 yrs) | ~$166.80 | $4.28 | 2.56% | ~42%–45% earnings | ~2.7% |
| CVX | Chevron Corp. | Aristocrat (39 yrs) | ~$216.35 | $7.12 | 3.29% | ~51%–55% FCF | ~6.0% |
| NEE | NextEra Energy | Aristocrat (32 yrs) | ~$80.30 | $2.49 | 3.10% | ~44%–53% EPS | ~9.0% |
| O | Realty Income | Aristocrat (32 yrs) | ~$59.20 | $3.288 | 5.55% | ~75% AFFO (REIT) | ~3.0%–4.0% |
Three sharp insights jump out of Table 1. First, streak length has almost zero correlation with current cash safety: Dover (71 years) and Lowe’s (63 years) retain roughly two-thirds or more of their earnings and free cash flow for reinvestment and buybacks, whereas Coca-Cola (64 years) and Genuine Parts (70 years) already distribute three-quarters of trailing free cash flow. Second, the highest-yielding Kings are often signaling margin or volume friction: PepsiCo’s 4.08% yield sits roughly 140 basis points above Procter & Gamble’s 2.65%, reflecting salty-snack volume digestion and a 72%–75% FCF payout that limits dividend acceleration until organic volumes normalize. Third, several 32-to-44-year Aristocrats offer better combined income and balance-sheet flexibility than 65-year Kings: Chevron yields 3.29% with a ~51%–55% payout and 6% dividend growth, while NextEra Energy yields 3.10% backed by regulated utility capex and ~9% historical payout growth.
A 65-year dividend streak proves past resilience; only free cash flow coverage after maintenance capital expenditure proves future solvency.
Top Dividend Stocks Editorial Audit Framework
Notice too how past Aristocrat exits—such as Walgreens Boots Alliance’s dividend cut and 3M’s post-spinoff reset in prior years—rarely came out of nowhere. In almost every documented dividend cut covered in our study of high-yield dividend survival rates, trailing FCF payout exceeded 80% for multiple quarters while net debt crept higher into a refinancing window. Protecting capital today means checking those early warning gauges outlined in our four-metric dividend trap screen rather than relying blindly on index membership.
Rate Refinancing, Capex Competition, and Cross-Border Net Yields
Why does a 5.12% 10-year Treasury yield squeeze Dividend Aristocrats and Kings beyond simple valuation multiples? Because corporate bond coupons issued during 2016–2021 at 2.0%–3.5% are steadily rolling off onto 5.0%–5.75% investment-grade refinancing schedules. For capital-intensive utilities (NEE, AWR), net-lease REITs (O), and M&A-driven healthcare giants (ABBV, JNJ), every 150 basis points of incremental debt interest slowly competes against the cash pool available for dividend raises.
Look at how that plays out across sectors. Regulated utilities like NextEra Energy must fund massive grid expansion to capture AI data-center load—an earnings driver we examined in detail in our analysis of FERC’s 2026 utility grid orders—which encourages utilities to keep dividend growth slightly below EPS growth or issue accretive equity. Consumer staples giants (PG, KO, PEP, CL) carry lighter capital intensity but face consumer pushback against cumulative price hikes; when pricing power stalls at 2%–3%, a company already paying out 75% of FCF must limit future dividend raises to low single digits.
For European and Swiss investors holding U.S. Dividend Aristocrats, the yield-spread arithmetic tightens another notch. Under standard U.S. double-taxation treaties with Form W-8BEN on file, a 15% U.S. dividend withholding tax reduces NOBL’s 1.93% gross yield to roughly 1.64% net before domestic income taxes (or 1.35% if held via a non-treaty account facing 30% withholding, before any reclaim). On a 2.65% Procter & Gamble yield, 15% withholding leaves 2.25% cash arriving in the brokerage account. Investors domiciled outside the United States must also account for the $60,000 U.S.-situs estate tax ceiling on direct U.S. stocks and ETFs—reviewed alongside treaty reliefs in our global dividend withholding tax guide and our UCITS dividend ETF comparison.
When to Own Aristocrats vs. Kings—and When to Pair Them With Higher Yield
Choosing between an Aristocrats ETF, selective Dividend Kings, or a blended income portfolio comes down to your horizon, tax jurisdiction, and whether you require spendable cash today or rising real income a decade from now.
Case for S&P 500 Dividend Aristocrats (e.g., NOBL / Selective Aristocrats)
- Equal-weight sector balance: Prevents mega-cap concentration while tilting automatically toward quality balance sheets.
- Higher blended growth headroom: Younger 25-to-45-year payers like Chevron, NextEra, and AbbVie often preserve stronger reinvestment runway than 70-year staples.
- Best suited for: Accumulation-stage investors with 10+ year horizons who reinvest dividends and value broad index discipline.
Case for Selective Dividend Kings (Individual Screening)
- Ultra-tested recession survival: 50+ year streaks weathered the 1970s stagflation, 2008 financial crisis, and 2020 shock without cutting.
- Dispersion favors stock-picking: Buying Dover (~36% FCF payout) or Lowe’s (~41%) avoids mature ~75% FCF staples without paying NOBL’s 0.35% fee.
- Best suited for: Taxable investors seeking low-turnover core holdings—paired with higher-yield REITs, BDCs, or defensive consumer staples.
Notice what neither cohort can solve alone at November 2026 Treasury yields: immediate retirement cash flow. Drawing $40,000 per year from a $1,000,000 portfolio requires a 4.0% blended yield; an all-NOBL portfolio generates barely $19,300 before taxes, forcing capital sales during drawdowns. Rather than stretching into fragile 12% yield traps, income retirees can anchor 40%–50% of equity exposure in low-payout Dividend Aristocrats and Kings for inflation protection while pairing them with screened 5%–8% cash-generative sleeves—such as the first-lien BDCs, net-lease REITs, and midstream infrastructure evaluated across our 2026 dividend income blueprint.
Practical Portfolio Checklist Before Buying Any Streak Stock
Multi-decade dividend streaks earn a seat on your watchlist, never an automatic buy order. Before adding any Dividend Aristocrat or Dividend King while 10-year Treasuries sit above 5%, verify four discipline checks:
- Audit FCF or AFFO payout—never GAAP EPS alone: Require corporate FCF payout below 65%–70% (or REIT AFFO payout below 80%) so modest earnings dips do not freeze future increases.
- Compare 5-year dividend CAGR against inflation and bond yields: Demand at least a 5% annual dividend growth rate if starting yield is under 3.0%, ensuring yield-on-cost crossover stays inside roughly 10–13 years.
- Inspect 2027–2029 debt maturities: Favor companies with staggered fixed-rate debt ladders and Net Debt/EBITDA under 2.5x (outside regulated utilities and REITs) to avoid coupon-refinancing squeeze.
- Price after-tax, not headline yield: Apply your local tax rate (and 15% treaty or 30% statutory withholding for non-U.S. investors) before comparing dividend stocks against Treasuries or UCITS equivalents.
Methodology, Definitions, and Yield-on-Cost Assumptions
Yield calculations reflect November 2026 annualized regular dividends divided by mid-November 2026 trading ranges; FCF payout ratios reflect trailing 12-month operating cash flow minus capital expenditures divided by total cash dividends paid, except where noted for regulated utilities (EPS/operating basis) and Realty Income (AFFO basis).
Yield-on-cost crossover calculations compare a hypothetical $100,000 investment at 2.50% starting yield growing at 6.0% annually (unreinvested cash stream) against a fixed 5.12% coupon. Taxes, brokerage commissions, and share price volatility are excluded from the pure cash-flow crossover equation.
Primary Sources and Data References
- Federal Reserve Bank of St. Louis (FRED): Market Yield on U.S. Treasury Securities at 10-Year Constant Maturity (DGS10) — Historical 2016–2026 Treasury benchmark yields.
- S&P Dow Jones Indices: S&P 500 Dividend Aristocrats Methodology & 2026 Rebalancing — Constituent count (69) and index eligibility rules.
- ProShares: NOBL S&P 500 Dividend Aristocrats ETF Factsheet — Expense ratio (0.35%), distribution yield, and equal-weight structure.
- Multpl: S&P 500 Dividend Yield Historical Year-End Series (2016–Nov 2026) — Broad index yield compression data.
- Johnson & Johnson Investor Relations, ExxonMobil Investor Relations, Realty Income Corp., and American States Water Co. — 2026 dividend declarations and streak records.