We originally set out to answer a single, concrete empirical question: of the twenty highest-yielding stocks in the world in any given year, what exact percentage survive the next twelve months without cutting their dividend? After auditing research from Hartford Funds, Ned Davis Research, Wellington Management, Vanguard, S&P Dow Jones Indices, WisdomTree, and Morningstar, we uncovered an uncomfortable truth: no institutional study publishes that exact annual top-20 mortality base rate—which means most internet claims about “safe 10% yields” are delivered with far more confidence than the evidence supports.
What the primary empirical data do prove—across 96 years of U.S. yield quintiles, 53 years of S&P 500 dividend policies, 11 years of Vanguard quality-sorted high-yielders, and our own audited SEC EDGAR Form 10-K dataset through November 2026—is far more actionable. A high dividend yield is not a cause of distress; it is a lagging symptom. And the difference between a surviving 6%–10% income machine and a wealth-destroying yield trap is almost always visible in the balance sheet and written dividend policy before the cut occurs.
What the Evidence Proves About High-Yield Dividend Survival
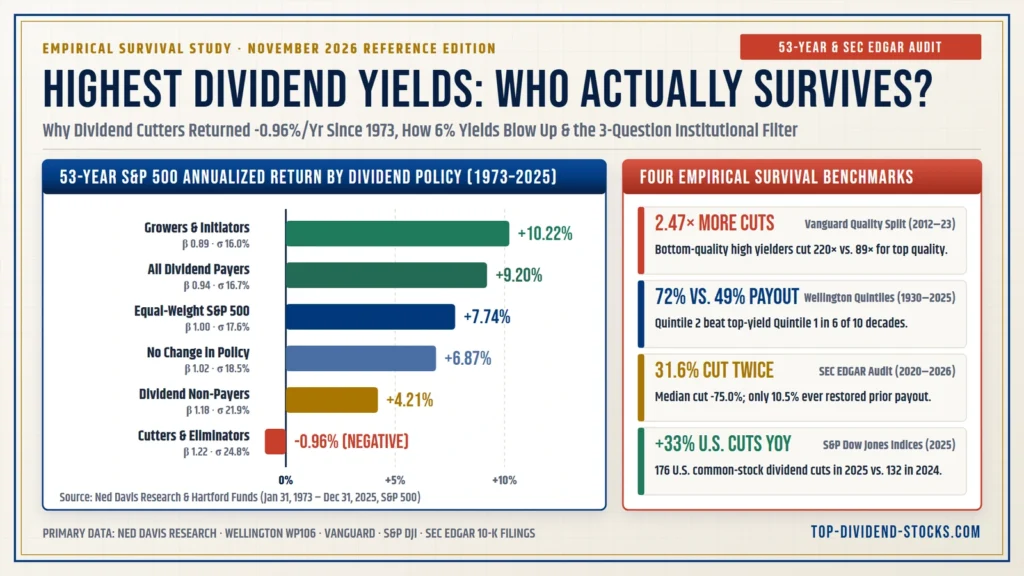
- Dividend Cutters Lost Money Over 53 Years (Ned Davis Research / Hartford Funds, 1973–2025): S&P 500 companies that cut or eliminated dividends returned -0.96% annualized with the highest volatility (24.80% std. dev., 1.22 beta)—versus +10.22% annualized (15.97% std. dev., 0.89 beta) for Dividend Growers and Initiators.
- Quality Splits High-Yield Cut Risk by 2.47× (Vanguard, 2012–2023): Inside the same universe of ~700 high-yielding Russell 3000 stocks, the lowest-quality quintile suffered 220 dividend cuts versus just 89 cuts in the highest-quality quintile.
- Quintile 2 Beat the Highest Yields in 6 of 10 Decades (Wellington WP106, 1930–2025): Second-highest yield stocks outperformed top-quintile yields because of sustainability—averaging a 49% payout ratio versus 72% in Quintile 1 (though Quintile 1 won in 4 decades, including 2020–2025).
- Cuts Accelerated +33% in 2025 & Continued in 2026 (S&P Dow Jones Indices): U.S. common-stock dividend decreases rose from 132 in 2024 to 176 in 2025 (with dollar hikes falling from $71.4B to $59.3B), followed by major 2026 cuts at LyondellBasell (-49.6%, Feb 2026) and Wendy’s (-50.0%, Aug 2026).
- Recovery Is Rare & Cuts Cascade (SEC EDGAR Audit, 2020–2026): Across 19 major audited U.S. dividend cuts, the median cumulative slash was -75.0%, 31.6% (6 of 19) cut a second time within 24 months, 90.0% of operational-collapse cuts showed pre-cut FCF/leverage failure in SEC filings, and only 10.5% (2 of 19; 0 of 7 Fallen Aristocrats/Kings) ever restored their pre-cut payout.
- 6% Yields Are Often Deadlier Than 13% Yields: Intel (~6% pre-cut yield → -100% eliminated) and 3M (~6%+ → -53.6%) tripped no retail yield alarms, proving debt covenants (>4.0x Net Debt/EBITDA) and Free Cash Flow cover beat every headline yield filter.
1. The One Number Not in Dispute: Why Dividend Cutters Lost -0.96%/Year for 53 Years
Everything else in high-yield investing is a footnote to a single fifty-three-year dataset. Between January 31, 1973 and December 31, 2025, Ned Davis Research and Hartford Funds sorted every S&P 500 constituent by its dividend policy. Dividend Growers and Initiators compounded at +10.22% per year with a defensive 0.89 beta. Companies that cut or eliminated their dividend returned -0.96% per year—not merely lagging the index, but actively destroying capital across five decades while exhibiting the highest volatility in the entire market (24.80% standard deviation).
Crucially, notice where the cut sits in the market sequence. By the time a corporate board formally announces a dividend reduction, the cash-flow deterioration is typically 12 to 24 months old and the share price has already dropped 30% to 50%—which is precisely what inflated the trailing yield to 7%, 9%, or 12% on retail stock screeners. The soaring headline yield and the subsequent dividend cut are not two separate events; they are the exact same balance-sheet event observed at different points in time.
Annualized Total Return, Beta & Volatility by Dividend Policy
Every S&P 500 constituent categorized monthly from January 31, 1973 through December 31, 2025. Notice how Cutters delivered negative returns alongside the highest risk.
2. Does the Highest Dividend Yield Quintile Really Lose? The Honest 96-Year Audit
Here is where institutional rigor matters more than financial folklore. Many blogs repeat as an iron law that “the highest dividend yield quintile always loses to the second quintile.” Look at the actual ten-decade data from Wellington Management and Hartford Funds (Whitepaper WP106, 1930–2025) below: Quintile 2 outperformed Quintile 1 in 6 decades out of 10—while Quintile 1 actually beat Quintile 2 in the 1940s, 1980s, 2000s, and 2020–2025 (13.40% vs. 10.37%).
The real signal in Wellington’s research is not that “top yields are cursed”—it is why Quintile 1 lags more often than not: over the study horizon, Quintile 1 stocks carried an average 72% dividend payout ratio compared to a far healthier 49% payout ratio in Quintile 2. High yield is not inherently fatal; excessive payout ratios with zero earnings cushion are—and that is a checkable property of every individual company before you buy.
Wellington Management WP106: Quintile 2 (49% Payout) vs. Quintile 1 (72% Payout)
Green cards mark the 5 decades where Second-Highest Yield (Q2) beat Highest Yield (Q1); gold cards mark the 5 decades where Q1 edged Q2 (including the negative 1930s). Across the full 96-year span, Q2 outperformed the S&P 500 in 6 of 10 decades—more frequently than any other quintile.
3. Ten Documented Dividend Cuts (2022–2026): Why 6% Yields Are Often Deadlier Than 13% Yields
Retail folklore assumes you are safe as long as you avoid double-digit yields above 10%. Real corporate cut announcements from 2022 through late 2026 destroy that assumption. Both Intel (~6% yield before its Feb 2023 cut → 100% eliminated in 2024) and 3M (~6%+ yield before halving its payout in May 2024) tripped zero retail yield alarms, yet inflicted deeper cumulative income destruction than visibly distressed 13%-yield Medical Properties Trust’s initial -48% cut.
In almost every operational collapse, the balance sheet—not the yield number—pulled the trigger: V.F. Corporation hit 4.5x gross debt/EBITDA against a 2.5x target; Hanesbrands eliminated its payout at 4.3x; Walgreens’ pre-cut FY2023 SEC Form 10-K showed a catastrophic 1,176.6% Free Cash Flow payout ratio ($141M FCF vs. $1.66B dividends); and Leggett & Platt’s CEO ended a 53-year Dividend King streak explicitly to accelerate deleveraging. That wave did not end in 2024: S&P Dow Jones Indices recorded 176 U.S. common-stock dividend cuts in 2025 (up +33.3% from 132 in 2024), followed by LyondellBasell (-49.6%, Feb 2026) and Wendy’s (-50.0%, Aug 2026).
Pre-Cut Yield vs. Cumulative Dividend Destruction Across 10 High-Profile Cuts
Gold yield badges flag “innocent-looking” 6%–7.6% yields that triggered zero retail alarms before slashing 48%–100% of shareholder income.
4. Today’s Highest Yields: The Crucial Distinction Between a “Promise” and a “Formula”
When you run a global stock screener for yields above 5%–6% today, you will immediately see dozens of stocks flashing trailing GAAP earnings payout ratios above 100%, 150%, or even 200%. Before rejecting them—or blindly buying them—separate every high-yielding stock into two completely different legal and accounting categories:
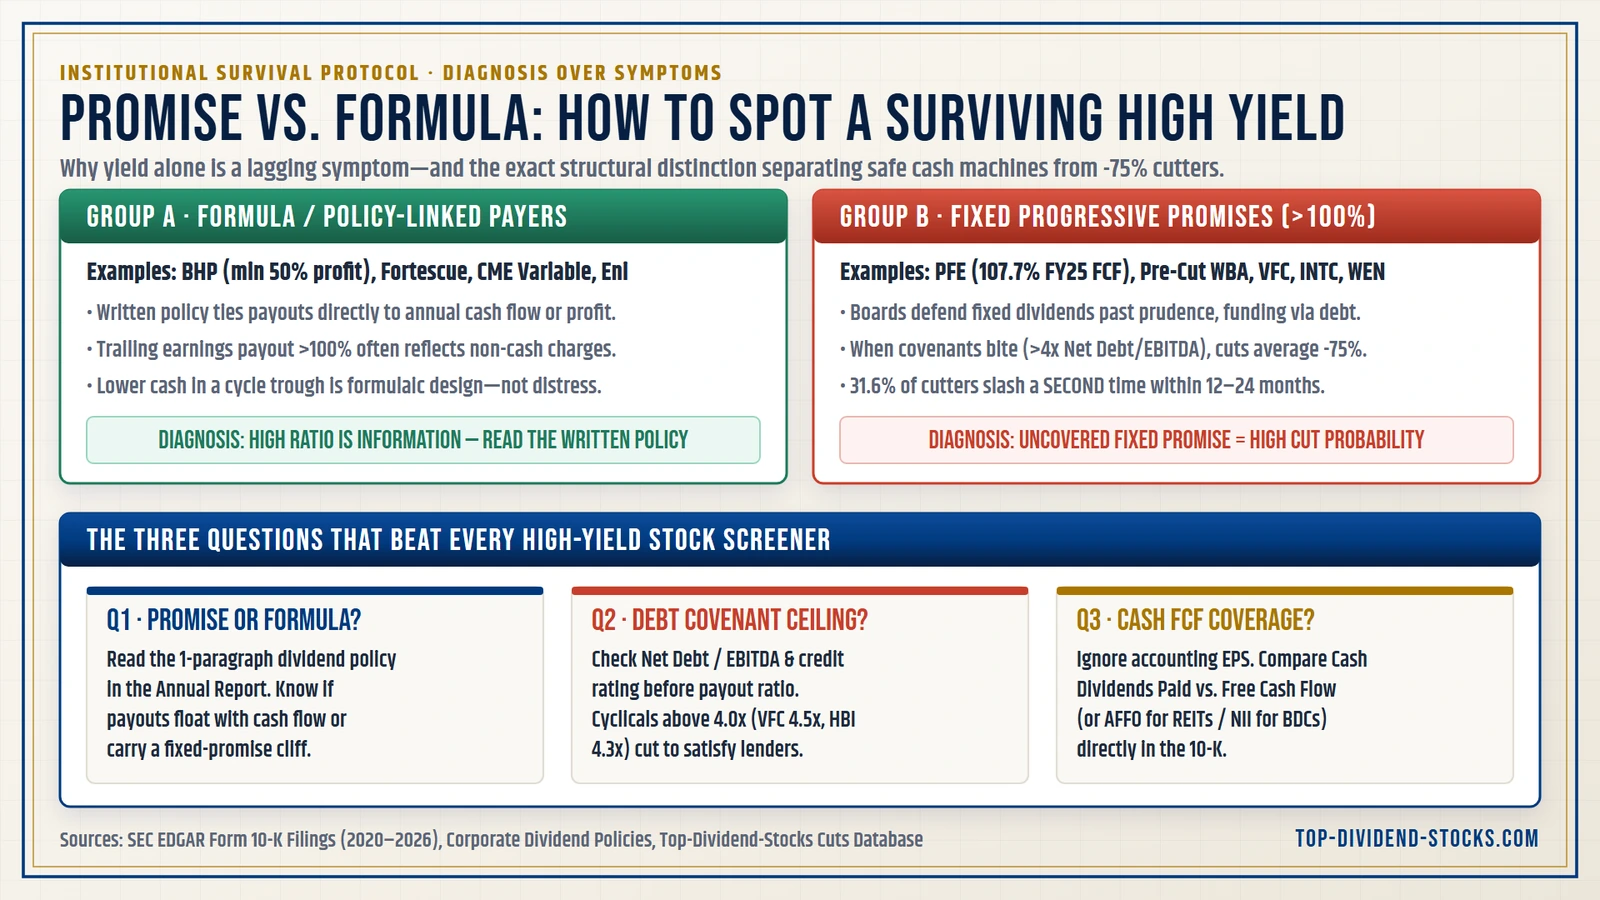
Group A: Formula / Policy-Linked Payers (High Ratios Are Design, Not Distress)
Commodity producers, derivatives exchanges, and shipping fleets—such as BHP (written minimum 50% of underlying attributable profit), Fortescue, Yancoal, New Hope, Eni, and CME Group (which sweeps excess cash annually via a variable dividend)—explicitly tie distributions to realized cash flow. When depreciation or non-cash impairments push their trailing GAAP earnings payout above 100%, that ratio tells you about accounting write-downs, not solvency risk. And when commodity prices fall, a lower payout is the formula working as advertised—not a distressed cut. (See how cyclical shipping payout formulas work in our shipping dividend yield analysis.)
Group B: Fixed Progressive Promises (Where Uncovered Cash Flow Signals Danger)
By contrast, fixed progressive payers—classic U.S. and European income anchors promising a steady or rising quarterly check—cannot quietly reduce payouts in a weak year without triggering institutional selling. That is why checking primary SEC Form 10-K cash coverage (rather than noisy third-party GAAP EPS screeners!) is non-negotiable. Look at how primary SEC EDGAR cash metrics separate genuine high-yield survivors from genuine warning zones in late 2026:
| Ticker & Company | Policy Structure | Approx. Yield (Nov ’26) | True Cash Coverage (SEC 10-K / Policy) | Screener Trap vs. Audited Reality | Survival Tier |
|---|---|---|---|---|---|
| MO · Altria Group | Fixed Progressive | ~6.2% – 6.8% | 76.7% FY25 FCF Payout ($6.96B div / $9.07B FCF) · 10-K | 2.2x Net Debt/FCF; mature high-margin cash machine | Covered Survivor |
| ARCC · Ares Capital | BDC (RIC 90% Rule) | ~10.0% – 10.2% | 86.7% FY25 NII Payout ($1.26B div / $1.46B NII) · 10-K | GAAP screeners falsely flag 143% EPS & -$1.7B OCF; NII covers cleanly | NII Covered (Cyclical) |
| O · Realty Income | Monthly Net-Lease REIT | ~5.4% – 5.8% | 75.6% FY25 FCF/AFFO Cover ($2.92B div / $3.86B FCF) · 10-K | GAAP EPS payout looks >250% due to non-cash property depreciation | Covered Survivor |
| VICI · VICI Properties | Experiential REIT | ~5.5% – 6.0% | 73.8% FY25 OCF Cover ($1.85B div / $2.51B OCF) · 10-K | 100% occupancy triple-net leases; CPI-linked escalators | Covered Survivor |
| CME / BHP / FMG | Formula / Variable | ~3.8% – 6.5% comb. | Policy-Linked Cash Sweep (CME $3.93B FY25 divs) · 10-K | Variable payouts fluctuate by design; never confuse with a distressed cut | Formula Payer |
| PFE · Pfizer Inc. | Fixed Progressive | ~6.2% – 6.8% | 107.7% FY25 FCF Payout ($9.77B div / $9.08B FCF) · 10-K | 6.7x Net Debt/FCF; fixed promise requires post-patent-cliff FCF turnaround | Stretched Watch |
| KMI · Kinder Morgan | Midstream Energy | ~4.5% – 5.2% | 90.1% FY25 FCF Payout ($2.60B div / $2.89B FCF) · 10-K | Heavy growth CapEx ($3.03B) trims GAAP FCF; monitor Distributable CF & debt | CapEx-Heavy Watch |
5. The Closest Thing to a Survival Base Rate: Vanguard’s 2.47× Quality Split
Because no academic or asset-management study publishes a raw annual “top-20 yield mortality rate,” the cleanest empirical base rate comes from Vanguard’s 11-year study (April 2012 – April 2023) of roughly 700 high-yielding U.S. stocks (the top 60% of yielders across the 2,000 largest Russell 3000 companies), sorted into quintiles by fundamental quality:
- Highest-Quality High-Yield Quintile: 89 dividend cuts over eleven years.
- Lowest-Quality High-Yield Quintile: 220 dividend cuts—nearly 2.47 times as many cuts inside the exact same high-yield pool.
- External Confirmation: Simply Safe Dividends tracked 938 corporate dividend cuts since 2015 and found that 97% carried a below-60 safety score prior to the cut announcement—mirroring our own SEC EDGAR finding that 90.0% of operational-collapse cuts exhibited glaring pre-cut FCF or leverage failure in public filings.
6. Interactive Diagnostic: Stress-Test Any High-Yield Stock’s Survival Odds
Apply the exact three institutional questions—(1) Promise vs. Formula, (2) Debt Covenant Ceiling, and (3) True Cash-Flow Coverage—to any high-yielding stock on your watchlist using the live survival scorer below.
High-Yield Dividend Survival & Cut-Risk Diagnostic Scorer
Enter any stock’s policy type, true cash payout ratio (FCF / AFFO / NII), leverage, yield, and cyclicality to compute its institutional survival resilience.
7. Frequently Asked Questions (Empirical Reference)
What percentage of the highest-yielding dividend stocks cut their dividends?
No institutional dataset publishes an exact annual mortality rate for the top-20 global yields. The best empirical proxy is Vanguard’s 11-year study (2012–2023) of ~700 high-yielding Russell 3000 stocks, which showed that lowest-quality high yielders suffered 220 dividend cuts versus 89 cuts in the highest-quality quintile (a 2.47× cut-risk gap).
What is the historical return of companies that cut or eliminate their dividends?
According to Ned Davis Research and Hartford Funds (S&P 500, January 1973–December 2025), dividend cutters and eliminators delivered a -0.96% annualized return with 24.80% standard deviation (1.22 beta)—compared with +10.22% annualized (15.97% standard deviation, 0.89 beta) for dividend growers and initiators.
Do the highest-yielding stocks always underperform the second-highest yield quintile?
No—it is a strong tendency, not an absolute law. In Wellington Management’s 1930–2025 study (WP106), Quintile 2 outperformed Quintile 1 in 6 of 10 decades primarily because Quintile 2 averaged a safer 49% payout ratio versus 72% in Quintile 1. However, Quintile 1 beat Quintile 2 in the 1940s, 1980s, 2000s, and 2020–2025.
How often do companies restore their dividend after cutting it?
Rarely. In our SEC EDGAR audit of 19 major U.S. dividend cuts from 2020 through November 2026 (Dividend Cuts & Recoveries Database), only 10.5% (2 of 19) ever restored their pre-cut payout—and 0 of 7 Fallen Dividend Aristocrats/Kings recovered. Meanwhile, 31.6% (6 of 19) cut a second time in a two-step cascade.
What is the difference between a policy-linked variable dividend and a fixed progressive dividend?
A policy-linked (formula) payer—like BHP (minimum 50% of underlying profit) or CME’s annual variable cash sweep—explicitly floats payouts with annual cash flow, so a lower payment in a downturn is formulaic design rather than distress. A fixed progressive payer promises a steady or rising payout; when cash flow fails to cover it, boards delay cuts until debt covenants force a severe (-50% to -100%) slash.
What debt ratio and payout ratio warn of an impending dividend cut?
Across cyclical and industrial businesses, Net Debt / EBITDA above 4.0x combined with a Free Cash Flow payout ratio exceeding 85%–100% is a far stronger cut predictor than headline yield. V.F. Corporation cut at 4.5x debt/EBITDA, Hanesbrands eliminated its payout at 4.3x, and Walgreens flashed a 1,176.6% FCF payout in its pre-cut Form 10-K.
Why do REITs and BDCs look dangerous on standard dividend stock screeners?
Standard screeners divide dividends by GAAP Net Income or GAAP Operating Cash Flow. For REITs (like Realty Income at 75.6% FCF/AFFO cover), non-cash property depreciation depresses GAAP EPS; for BDCs (like Ares Capital at 86.7% NII payout), new loan originations turn GAAP OCF negative (-$1,717M in FY2025). Always use AFFO for REITs and NII for BDCs. (See our 2026 BDC payout-durability ranking.)
Can a 6%–10% dividend yield ever be safe?
Yes—when the yield reflects mature, capital-light cash generation or mandatory RIC/REIT distribution rules rather than operational distress. Altria (~6.5% yield on 76.7% FCF payout), Realty Income (~5.6% on 75.6% FCF/AFFO cover), VICI Properties (~5.8% on 73.8% OCF cover), and Ares Capital (~10.1% on 86.7% NII payout) demonstrate that covered high yields survive when screened via primary filings. (Explore our full 5-Gate Safe High-Yield Audit.)
8. Sources, Methodology & Risk Disclosure
Primary Empirical Sources Cited: (1) Ned Davis Research & Hartford Funds, The Power of Dividends: Past, Present, and Future (S&P 500 constituents, Jan 31, 1973–Dec 31, 2025); (2) Wellington Management & Hartford Funds Whitepaper WP106 (S&P 500 dividend yield quintiles by decade, 1930–Dec 31, 2025); (3) Vanguard high-yield Russell 3000 quality study (Apr 2012–Apr 2023); (4) S&P Dow Jones Indices U.S. common-stock dividend action reports (2023–2025); (5) Primary SEC EDGAR Form 10-K / Form 8-K filings through November 2026 for MO, ARCC, O, VICI, CME, PFE, KMI, and all 19 constituents of our 2020–2026 Dividend Cuts & Recoveries Database.
Continue Your Institutional Research: Run our full 5-Gate Safe High-Yield Dividend Screen, inspect fund-level distribution risks in Return of Capital & NAV Erosion, review global capital-return trends in our 2026 Global Dividends Outlook, or build an all-weather allocation via our Dividend Strategies Hub.
Educational Disclaimer: This empirical research study is published solely for educational and informational purposes and does not constitute personalized investment, legal, or tax advice. High-yielding equities, REITs, BDCs, and commodity producers carry elevated capital-loss, credit, leverage, and dividend-cut risks, and historical survival rates never guarantee future distributions. Always audit primary SEC filings and consult a qualified fiduciary advisor before investing.