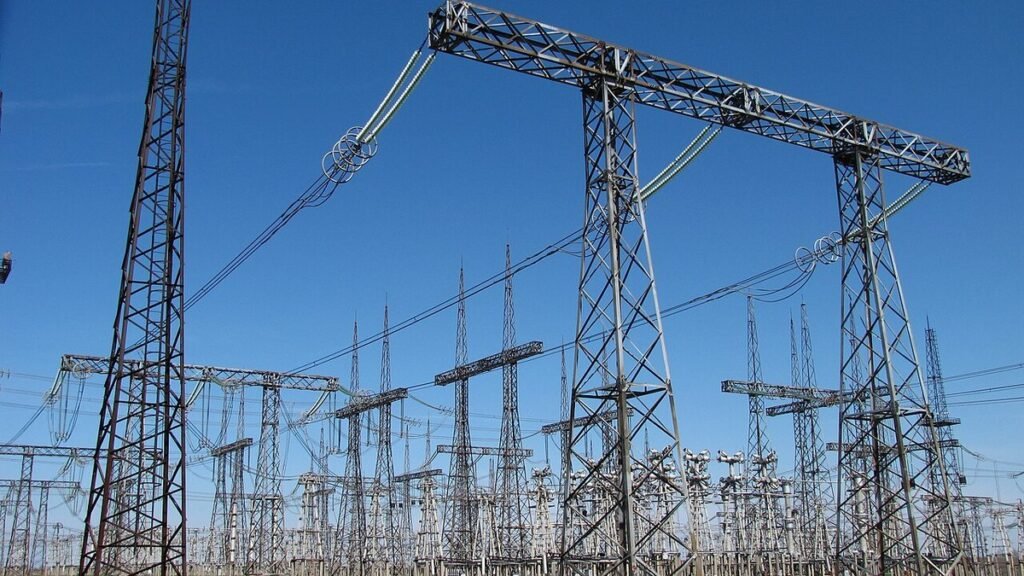
There is an argument running through every American utility regulator right now, and it is not really about electricity. It is about who pays. A hyperscaler wants 300 megawatts in a county that has never needed more than 400 in total. Somebody has to build the substation, the transmission and probably the generation. The question is whether that cost lands on the company that asked for the power, or on the retired schoolteacher two towns over whose bill goes up 9% and who never heard of the data centre.
On 18 June 2026 the Federal Energy Regulatory Commission gave its answer. It is a good answer, and if you own utility shares for income it is worth understanding — but it is not the answer that decides what your dividend does over the next five years. That one is duller, and nobody is arguing about it, which is exactly why it is worth writing down.
What FERC actually did
FERC issued six show-cause orders under section 206 of the Federal Power Act — one to each jurisdictional grid operator: PJM, MISO, SPP, CAISO, ISO-NE and NYISO. Each has to justify its existing interconnection rules for very large loads or rewrite them. A “large load” means a peak of more than 50 MW connecting at more than 69 kV, which in practice means a data centre.
The substance is in the cost allocation. Large loads must now make a minimum financial contribution to the transmission owner’s revenue requirement, secured by strict credit support, and pay for regulation and black-start services on gross demand rather than net. In plain terms: if you want to plug in a gigawatt, you post collateral and you pay for the wires, rather than leaving the bill with existing customers if your project is cancelled. The grid operators had 30 days to file resource-adequacy reports and 60 days to respond substantively.
PJM matters most here. It expects to host as much as 70% of the data centres built in the United States, and roughly 30 GW of new demand by 2030 — which is why its rules were the ones everybody was watching.
This is genuinely good news for the sector’s biggest political risk. A wave of state-level backlash against data-centre power was the thing that could have turned a growth story into a rate-case bloodbath. FERC has taken a large piece of that risk off the table. What it has not done — what it cannot do — is change the arithmetic of how a utility funds a capital programme.
The scale of what is being built
Start with demand, because the numbers have moved fast enough that most published figures are already stale. The Department of Energy’s Lawrence Berkeley National Laboratory put US data-centre consumption at 192 TWh in 2024, or 4.7% of all American electricity. Its June 2026 update projects 521–843 TWh by 2030 — between 9.5% and 15.3% of national consumption. The share of the country’s electricity going into computing roughly doubles, and may triple, inside six years.
Utilities are responding the only way they can, which is by spending.
Utility capital spending has doubled, and the steep part is still ahead
Total capital expenditure of US investor-owned electric utilities, $ billions. Solid line is reported spending; the second line is the industry's own forward projection.
EEI puts actual spending across 2015–2024 at about $1.3 trillion and projects a further $1.1 trillion across 2025–2029. The money has to come from somewhere, and that is the part of the story income investors keep skipping.
Edison Electric Institute, Industry Capital Expenditures, September 2025. 2025–2029 are EEI projections.
Show the data
| Year | Capex ($bn) | Basis |
|---|---|---|
| 2015 | 104.0 | Reported |
| 2016 | 112.5 | Reported |
| 2017 | 113.1 | Reported |
| 2018 | 119.2 | Reported |
| 2019 | 123.8 | Reported |
| 2020 | 132.7 | Reported |
| 2021 | 134.1 | Reported |
| 2022 | 147.7 | Reported |
| 2023 | 171.9 | Reported |
| 2024 | 178.2 | Reported |
| 2025 | 207.9 | Projected |
| 2026 | 220.7 | Projected |
| 2027 | 231.4 | Projected |
| 2028 | 241.5 | Projected |
| 2029 | 248.4 | Projected |
Note what that chart is not saying. It is not saying utilities are in trouble. Regulated capital spending is how a utility grows: money goes into the rate base, the regulator allows a return on it, earnings per share rise. That is the entire business model and it works. The Edison Electric Institute’s members put about $1.3 trillion into the ground across 2015–2024 and project a further $1.1 trillion across 2025–2029, and the sector is guiding to the strongest earnings growth it has had in a generation.
The problem is the word per share.
The gap nobody is talking about
A utility funds a build like this from four places: operating cash flow, debt, asset sales, and new equity. The first three have limits. Operating cash flow is what it is. Debt is capped by the credit rating — push the ratio too far and Moody’s downgrades you, which raises the cost of everything else. Asset sales are finite. So the balancing item, in almost every case, is issuing shares.
New shares dilute. Earnings can grow 8% while earnings per share grows 6% and the dividend per share grows 2%, and no single decision along that chain looks unreasonable. Here is what that looks like across the sector right now.
The gap between what earnings are doing and what the dividend is doing
Company earnings-per-share growth guidance against the actual increase in the dividend over the past year, %.
Earnings can grow faster than the dividend for years without anything being wrong. But when the wedge is this wide across an entire sector at once, it is usually telling you where the cash is going instead.
Company guidance and dividend declarations, Q2 2026 results and investor materials. EPS figures are the midpoint of stated ranges. NextEra shows its revised 6% dividend target rather than a trailing increase.
Show the data
| Company | EPS growth guidance | Dividend growth | Gap |
|---|---|---|---|
| Southern | 8–9% | 2.7% | 5.8pp |
| Duke | 5–7% | 1.9% | 4.1pp |
| AEP | 7–9% | 2.2% | 5.8pp |
| Sempra | 7–9% | 3.0% | 5.0pp |
| Portland General | 5–7% | 5.0% | 1.0pp |
| NextEra | 8%+ | 6.0% target | 2.0pp |
Every one of those companies is telling you, in its own investor materials, that it expects to earn more. Every one of them is also handing shareholders a raise that runs well behind that number. The wedge is the share count and the retained cash that funds the build.
Duke Energy: the clearest case
Duke has the largest capital plan of any regulated US utility — $103 billion over five years, raised by $16 billion in a single revision, with management flagging a further $5–10 billion of upside from data-centre demand. Its chief executive says the company is deploying more than a billion dollars of capital every month.
Against that: a dividend increase of 1.9% over the past year, roughly $10 billion of equity planned between 2027 and 2030, and an FFO-to-debt ratio of 14.8% in FY2025 against Moody’s 15% threshold. Duke has paid a dividend for a century. Nobody sensible expects it to stop. But a payout growing at 1.9% while inflation runs above that is a dividend that is quietly shrinking in real terms, and the credit cushion underneath it is thinner than it was.
NextEra: the target that got halved
This is the single most under-discussed fact in the sector. In February 2024 NextEra told investors to expect dividend growth of roughly 10% a year through at least 2026. At its December 2025 investor conference, that became 6% a year through 2028. Same company, same demand story, better growth outlook — and the dividend growth rate cut by four percentage points.
Then, in May 2026, NextEra agreed to combine with Dominion Energy in an all-stock deal. The merged company would carry a $138 billion rate base and spend roughly $335–375 billion between 2027 and 2032. Planned annual equity issuance goes from about $2 billion standalone to about $4 billion pro forma. The 6% dividend policy carries over.

Portland General: no room left
Portland General Electric sits in one of the fastest-growing industrial-load regions in America, with industrial demand compounding at about 10% a year through 2030. Its board tells investors it targets a payout of 60–70% of earnings. It is currently paying 97.5%.
Where the cushion has already gone
Trailing dividend payout ratio, % of earnings paid out. The dashed line is the top of Portland General's own stated target range.
Portland General's board has told investors it targets 60–70% of earnings. It is paying 97.5%. That is not a scandal — regulated earnings are lumpy and rate cases catch up — but it is the definition of a dividend with no room left in it.
Trailing payout ratios via stockanalysis.com, 22–29 August 2026. Payout ratios move with earnings and should be re-checked before acting on them.
Show the data
| Company | Payout ratio | Dividend yield |
|---|---|---|
| Portland General | 97.5% | 4.45% |
| Dominion | 93.3% | 4.07% |
| Sempra | 76.0% | 3.17% |
| Southern | 73.2% | 3.45% |
| AEP | 65.8% | 3.11% |
| Duke | 65.2% | 3.61% |
| NextEra | 56.0% | 3.05% |
| Constellation | 16.5% | 0.61% |
A payout ratio is a snapshot, not a verdict — regulated earnings are lumpy, rate cases catch up, and a single weak year distorts the number. If the term is new to you, our guide to dividend terminology explains how it is calculated and where it misleads. But a utility paying 97 cents of every earnings dollar while funding a build-out with forward equity sales and an at-the-market programme has used up its margin for error. So has Dominion at 93%, with a dividend that has not moved.
The two that found another way
Not everyone is issuing equity, and the exceptions are the most instructive part of this story.
Sempra has a $65 billion plan for 2026–2030, more than 95% of it regulated, and expects to eliminate the need for common equity issuance across that plan — funding it instead through its infrastructure partnership with KKR and capital recycling. Same demand, same capex pressure, no dilution. If the thesis in this article is right, Sempra’s dividend should compound closer to its earnings than its peers’ do.
Constellation Energy went the other way entirely. It is a merchant nuclear operator, not a regulated utility: 0.61% yield, a 17% payout ratio, and about $2.2 billion of its own stock bought back so far this year. It is a fine business and a superb way to own the AI power theme. It is not an income stock, and nobody should buy it as one.
Dominion is the whole argument in one company
If you want the cautionary tale compressed, it is here. In November 2020 Dominion cut its dividend by 33%, from $0.94 to $0.63 a quarter, after selling $9.7 billion of gas assets to Berkshire Hathaway and abandoning the Atlantic Coast Pipeline. Management framed it as aligning with best-in-class peers, and reset the payout to about 65%.
Six years later that payout ratio is back at 93%, the dividend has stopped growing, and the company has agreed to be absorbed into NextEra — where holders will receive a 6%-a-year dividend policy in place of standalone control. A single utility, in six years, walking the whole length of the argument: big project, failed financing, cut, slow recovery, acquisition.
What we would actually ask before buying one of these
The question is not “which utility has the most data-centre load”. Everyone has data-centre load now; it is priced. The questions that separate the outcomes are financing questions.
How is the capital plan funded? Find the equity number. It is in the investor deck, usually one slide from the back. A company issuing 1.6% of its market capitalisation in shares every year for six years is handing you a headwind of roughly that size on per-share everything.
What is the gap between EPS guidance and the last dividend increase? If earnings are guided at 8% and the raise was 2%, management has told you where the cash is going for the next several years. That is not dishonest — it is disclosed — but it is rarely the number in the headline.
Where is the payout ratio relative to the company’s own stated target? Not relative to the sector. Relative to what that board said it was aiming for. Portland General’s 97% against its own 60–70% target says more than any peer comparison — and as we found when we went through the world’s highest yields, a payout ratio above a company’s own promise is the most reliable early signal there is.
How much credit cushion is left? FFO-to-debt against the rating agency’s threshold is the most useful single number in a regulated utility, because when it gets tight the equity issuance gets larger, and when equity is unavailable the dividend is what flexes.
What would change our mind
Three things would make us more constructive. A wave of state-level large-load tariffs actually collecting cash from hyperscalers up front, which would reduce the equity need directly. More Sempra-style structures — infrastructure partners and asset recycling in place of common equity. And rate-case outcomes that let allowed returns rise with the cost of capital rather than lagging it by two years.
Two things would make us more cautious. Any sign that the load forecasts are speculative — the same gigawatt being counted by three utilities because a hyperscaler has applied in three places to keep its options open. And a credit downgrade at a large payer, because that is the moment the financing mix stops being a choice.
The point
The AI power story is real. Electricity demand from computing is going from under 5% of American consumption to something between 9.5% and 15% in six years, and the companies that carry that power will earn a regulated return on every dollar they spend getting it there. We are not arguing with any of that; our guide to AI power dividend stocks lays out which businesses are best placed, and our screen of energy and utility stocks on high dividends and low multiples covers the valuation side.
What we are arguing is that the growth story and the income story are not the same story, and right now the market is pricing the first one and quoting you the second. A sector guiding 5–9% earnings growth and delivering 2–3% dividend growth is telling you, plainly, that shareholders are funding the build. That may still be the right investment. It is just not the investment most people think they are making.
If you want the dividend to compound rather than merely survive, the same discipline applies here as everywhere else: look at what actually makes a payout safe, and remember that in a capital-intensive sector the dividend is the residual, not the priority. The same financing question decides the other great capex story of this cycle — we ask it of the defence primes in US versus European defence dividends.