Author: Asel (Wealth Management Professional, Switzerland) | Last Audited: November 19, 2026 | Primary Data Cutoff: SEC EDGAR Form 10-K & Form 10-Q filings through November 17, 2026 (n = 19 U.S. public issuers).
Editorial Disclosure: This research is published strictly for educational and informational purposes and does not constitute personalized financial, investment, legal, or tax advice. Historical corporate dividend histories and recovery rates do not guarantee future payout outcomes.
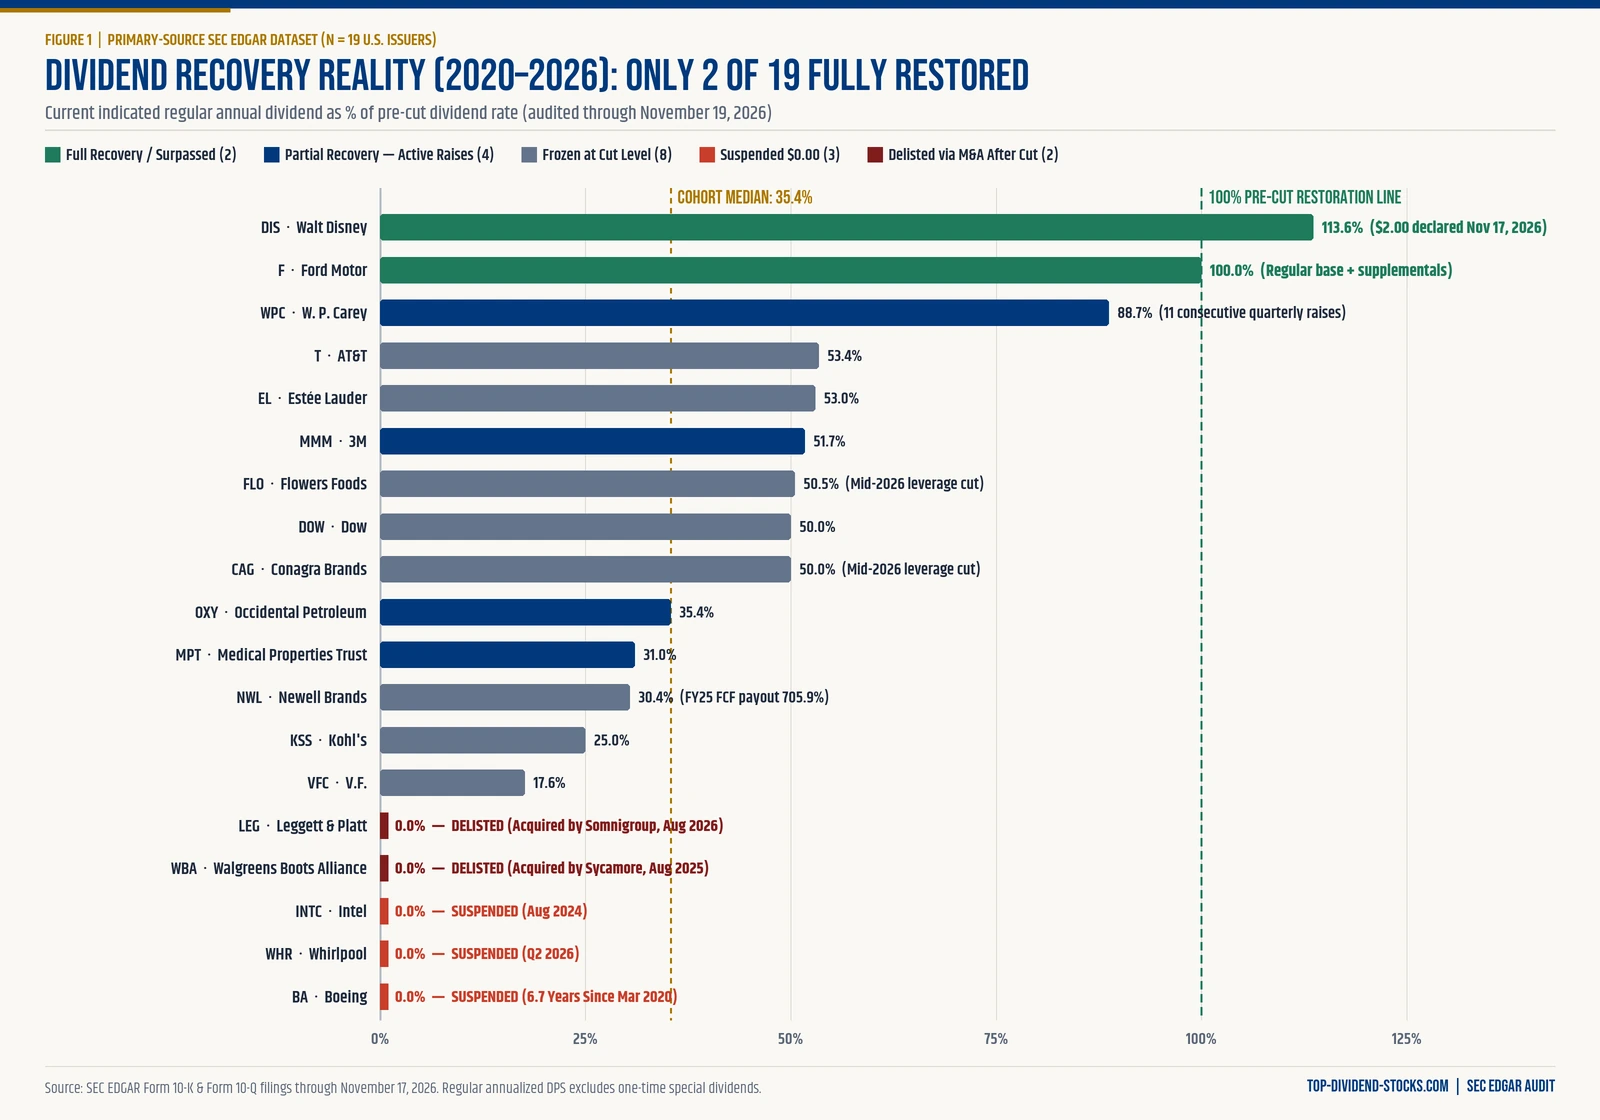
As of November 19, 2026, a Top Dividend Stocks primary-source audit of U.S. SEC EDGAR Form 10-K and Form 10-Q filings across 19 landmark U.S. dividend cuts and suspensions between March 2020 and July 2026 finds that only 2 of 19 companies (10.5%) have fully restored their pre-cut regular annual dividend—and zero of the 15 non-pandemic cutters (0.0%) have returned to their prior payout level.
Both full recoveries—The Walt Disney Company (which declared a $2.00 annual dividend in its November 17, 2026 Form 10-K, reaching 113.6% of its pre-pandemic $1.76 rate) and Ford Motor Company (100.0% regular base restored alongside supplemental distributions)—were 2020 pandemic liquidity suspensions. By contrast, across operational cash-flow collapses, corporate spin-offs, and leverage-driven resets from 2022 through 2026, the median cumulative payout reduction reached 75.0%, nearly one-third (31.6%) of cutters slashed their dividend a second time or suspended it completely, and two former Dividend Aristocrats/Kings—Walgreens Boots Alliance and Leggett & Platt—were ultimately acquired and delisted from U.S. exchanges in August 2025 and August 2026.
Key Research Findings (Audited Through November 19, 2026)
- Full dividend restoration is rare outside exogenous shocks (10.5% overall; 0.0% for non-pandemic cuts): Only Disney (FY2026 Form 10-K, filed November 17, 2026) and Ford (FY2025 Form 10-K) match or exceed their pre-cut regular payout. Eight of 19 companies (42.1%) remain frozen at their post-cut rate, three (15.8%) remain suspended at $0.00, and two (10.5%) were delisted after cutting.
- One in three cutters triggers a “Two-Step Cut Cascade” (6 of 19, or 31.6%): Buying immediately after an initial “reset” cut exposed investors to a second cut or full suspension in 31.6% of cases—including Walgreens (Jan 2024 → Jan 2025), V.F. Corp. (Feb 2023 → Oct 2023), Intel (Feb 2023 → Aug 2024), Medical Properties Trust (Aug 2023 → Aug 2024), Occidental Petroleum (Mar 2020 → May 2020), and Whirlpool (Jul 2025 → Q2 2026, per Whirlpool Q3 2026 Form 10-Q).
- Cash-flow filings warned ahead of 90.0% of operational cuts (9 of 10): Nine of the ten Operational FCF Collapse cutters exhibited negative GAAP Free Cash Flow, an FCF payout ratio of 100% or higher, or (for REITs) cash dividends exceeding operating cash flow in at least one of the two fiscal years preceding the cut—including Walgreens at 1,176.6% FCF payout (FY2024 Form 10-K), Intel at -$9,411M FCF (FY2025 Form 10-K), and Dow Inc. at -$26M FCF (FY2025 Form 10-K).
- The 2026 “Healthy-FCF Leverage Cut” blind spot: Both landmark mid-2026 Consumer Staples cuts—Flowers Foods (-49.5%, May 21, 2026, ending a 24-year streak; FY2025 Form 10-K) and Conagra Brands (-50.0%, July 15, 2026; FY2026 Form 10-K)—occurred with trailing GAAP FCF payout ratios of just 65.6% and 68.4%. Elevated M&A debt ($6,238.0M Net Long-Term Debt at Conagra, or 6.4x FCF; +32.7% debt jump at Flowers Foods) forced both boards to halve payouts.
- 40.0% of audited former Dividend Aristocrats and Kings were delisted via M&A after cutting: Of the five official fallen Aristocrats/Kings (MMM, WBA, VFC, LEG, T), two (WBA and LEG) ceased trading as independent public companies within 19 to 28 months of their initial cut, while none (0.0%) have restored their pre-cut payout.
Table of Contents
- Main Dataset: 19 SEC-Audited U.S. Dividend Cuts & Recoveries (2020–2026)
- 1. Fallen Dividend Aristocrats & Kings: From Multi-Decade Streaks to M&A Delisting
- 2. The Two-Step Cut Cascade: Why the First Cut Rarely Marks the Floor
- 3. Pre-Cut Cash-Flow Warnings vs. the 2026 Healthy-FCF Leverage Blind Spot
- 4. Avoiding the REIT Screening Trap: AFFO and Normalized FFO vs. GAAP FCF
- 5. Original Analysis: Post-Cut Recovery Taxonomy Across 4 Trigger Archetypes
- Practical Tool Specification: Dividend-Cut Stress & Coverage Calculator
- Methodology, Accounting Reconciliations & Limitations
- Source-Backed Frequently Asked Questions
- Last Updated & How to Cite This Dataset
Main Dataset: 19 SEC-Audited U.S. Dividend Cuts & Recoveries (2020–2026)
Every figure below is reconciled directly from SEC EDGAR Form 10-K and Form 10-Q filings through November 17, 2026. Regular annualized DPS excludes one-time special distributions. Equity REITs (WPC, MPT) are evaluated on SEC-reported AFFO or Normalized FFO rather than GAAP Operating Cash Flow minus CapEx.
| Ticker & Company | Sector | Trigger | Cut Date(s) | Pre → Trough DPS/Yr | Cum. Cut % | Pre-Cut Coverage | Nov 2026 DPS/Yr | % of Pre-Cut | Status (Nov 19, 2026) | Primary SEC Filing |
|---|---|---|---|---|---|---|---|---|---|---|
| DIS Walt Disney Company | Communication Services | Pandemic / Exogenous Shock | 2020-05 | $1.76 → $0.00 | -100.0% | 261.3% (FY2019) | $2.00* | 113.6% | Full Recovery & Surpassed | 10-K (2026-11-17) |
| F Ford Motor Company | Consumer Discretionary | Pandemic / Exogenous Shock | 2020-03 | $0.60 → $0.00 | -100.0% | 23.9% (FY2019) | $0.60 | 100.0% | Full Recovery & Surpassed | 10-K (2026-02-11) |
| WPC W. P. Carey Inc. | Real Estate (REIT) | Spin-Off / Structural Rebase | 2023-12 | $4.284 → $3.44 | -19.7% | 82.7% (REIT AFFO) (FY2023) | $3.80 | 88.7% | Partial Recovery | 10-K (2026-02-11) |
| T AT&T Inc. | Communication Services | Spin-Off / Structural Rebase | 2022-02 | $2.08 → $1.11 | -46.6% | 57.0% (FY2021) | $1.11 | 53.4% | Frozen at Cut Level | 10-K (2026-02-09) |
| EL Estée Lauder Companies Inc. | Consumer Staples | Operational FCF Collapse | 2024-10 | $2.64 → $1.40 | -47.0% | 65.7% (FY2024) | $1.40 | 53.0% | Frozen at Cut Level | 10-K (2026-08-19) |
| MMM 3M Company | Industrials | Spin-Off / Structural Rebase | 2024-05 | $6.04 → $2.80 | -53.6% | 65.4% (FY2023) | $3.12 | 51.7% | Partial Recovery | 10-K (2026-02-03) |
| FLO Flowers Foods | Consumer Staples | Leverage / Balance-Sheet Realignment | 2026-05 | $0.99 → $0.50 | -49.5% | 65.6% (FY2025) | $0.50 | 50.5% | Frozen at Cut Level | 10-K (2026-02-25) |
| DOW Dow Inc. | Materials | Operational FCF Collapse | 2025-07 | $2.80 → $1.40 | -50.0% | NEG FCF (FY2024) | $1.40 | 50.0% | Frozen at Cut Level | 10-K (2026-02-03) |
| CAG Conagra Brands | Consumer Staples | Leverage / Balance-Sheet Realignment | 2026-07 | $1.40 → $0.70 | -50.0% | 68.4% (FY2026) | $0.70 | 50.0% | Frozen at Cut Level | 10-K (2026-07-15) |
| OXY Occidental Petroleum Corporation | Energy | Pandemic / Exogenous Shock | 2020-03 & 2020-05 | $3.16 → $0.04 | -98.7% | 256.4% (FY2019) | $1.12 | 35.4% | Partial Recovery | 10-K (2026-02-18) |
| MPT Medical Properties Trust | Real Estate (REIT) | Operational FCF Collapse | 2023-08 & 2024-08 | $1.16 → $0.32 | -72.4% | 73.0% (REIT Normalized FFO) (FY2023) | $0.36 | 31.0% | Partial Recovery | 10-K (2026-02-26) |
| NWL Newell Brands Inc. | Consumer Discretionary | Operational FCF Collapse | 2023-05 | $0.92 → $0.28 | -69.6% | NEG FCF (FY2022) | $0.28 | 30.4% | Frozen at Cut Level | 10-K (2026-02-13) |
| KSS Kohl’s Corporation | Consumer Discretionary | Operational FCF Collapse | 2025-03 | $2.00 → $0.50 | -75.0% | 122.0% (FY2024) | $0.50 | 25.0% | Frozen at Cut Level | 10-K (2026-03-19) |
| VFC V.F. Corporation | Consumer Discretionary | Operational FCF Collapse | 2023-02 & 2023-10 | $2.04 → $0.36 | -82.4% | NEG FCF (FY2023) | $0.36 | 17.6% | Frozen at Cut Level | 10-K (2026-05-20) |
| LEG Leggett & Platt | Industrials | Operational FCF Collapse | 2024-04 | $1.84 → $0.20 | -89.1% | 62.4% (FY2023) | Delisted | 0.0% | Delisted After Cut | 10-K (2026-02-26) |
| WBA Walgreens Boots Alliance | Consumer Staples | Operational FCF Collapse | 2024-01 & 2025-01 | $1.92 → $0.00 | -100.0% | 1176.6% (FY2023) | Delisted | 0.0% | Delisted After Cut | 10-K (2024-10-15) |
| INTC Intel Corporation | Information Technology | Operational FCF Collapse | 2023-02 & 2024-08 | $1.46 → $0.00 | -100.0% | NEG FCF (FY2022) | $0.00 | 0.0% | Suspended | 10-K (2026-01-23) |
| WHR Whirlpool Corporation | Consumer Discretionary | Operational FCF Collapse | 2025-07 & 2026-04 | $7.00 → $0.00 | -100.0% | 100.0% (FY2024) | $0.00 | 0.0% | Suspended | 10-K (2026-02-11) |
| BA Boeing Company | Industrials | Pandemic / Exogenous Shock | 2020-03 | $8.22 → $0.00 | -100.0% | NEG FCF (FY2019) | $0.00 | 0.0% | Suspended | 10-K (2026-01-30) |
1. Fallen Dividend Aristocrats & Kings: From Multi-Decade Streaks to M&A Delisting
Income investors often treat a 25-year S&P 500 Dividend Aristocrat or 50-year Dividend King streak as an implicit guarantee of capital durability. As our companion analysis of Dividend Aristocrats vs. Dividend Kings in a higher-rate regime explains, multi-decade streaks are backward-looking corporate artifacts—not forward-looking cash-flow covenants.
This SEC audit tracks seven iconic multi-decade streaks broken between 2022 and 2026: five official former Dividend Aristocrats or Dividend Kings (3M, Walgreens Boots Alliance, V.F. Corp., Leggett & Platt, and AT&T) plus two companies that cut in their 24th consecutive year of increases just shy of the 25-year Aristocrat threshold (W. P. Carey and Flowers Foods).
- Zero full recoveries (0 of 7, or 0.0%): Not a single broken multi-decade streak in this database has returned to its pre-cut annual regular dividend. Only W. P. Carey (88.7% recovered after 11 consecutive quarterly increases following its office spin-off) and 3M (51.7% recovered after two annual raises following the Solventum spin-off) have resumed steady dividend growth.
- Two out of five official Aristocrats/Kings were delisted via M&A (40.0%): Walgreens Boots Alliance (47-year streak) cut from $0.48 to $0.25/quarter in January 2024 after FY2023 FCF fell to $141M against $1,659M in cash dividends (1,176.6% payout), suspended to $0.00 in January 2025, and was acquired by Sycamore Partners and delisted on August 28, 2025. Leggett & Platt (52-year streak) slashed its payout 89.1% ($0.46 → $0.05/quarter) in April 2024, stayed frozen for nine quarters, signed a merger agreement with Somnigroup International on April 13, 2026 (LEG Q2 2026 Form 10-Q), and delisted from the NYSE on August 26, 2026.
- Long freezes erode real purchasing power: AT&T has held its post-spin-off quarterly dividend unchanged at $0.2775 ($1.11/yr) for more than 18 consecutive quarters through Q3 2026 (T Q3 2026 Form 10-Q), while V.F. Corp. has remained locked at $0.09/quarter (17.6% of its pre-cut $0.51 rate) for 12 straight quarters.
2. The Two-Step Cut Cascade: Why the First Cut Rarely Marks the Floor
A pervasive behavioral error among value-oriented income investors is treating the first dividend cut as a “clearing event” that permanently de-risks the payout. Our SEC filing audit directly contradicts that assumption: 6 of 19 companies (31.6%) executed a Two-Step Cut Cascade, reducing their dividend a second time—or suspending it completely to $0.00—within 2.6 to 17.3 months of the initial reduction.
| Ticker | Step 1 Cut (Date & Change) | Step 2 Cut / Suspension (Date & Change) | Elapsed Time | Primary Cash-Flow Driver in SEC Filings |
|---|---|---|---|---|
| OXY | Mar 10, 2020 ($0.79 → $0.11, -86.1%) | May 29, 2020 ($0.11 → $0.01, -98.7% cum.) | 2.6 months | Oil price collapse colliding with $38,537M Anadarko acquisition debt |
| VFC | Feb 7, 2023 ($0.51 → $0.30, -41.2%) | Oct 30, 2023 ($0.30 → $0.09, -82.4% cum.) | 8.7 months | FY23 FCF collapsed to -$808.0M alongside $5,695M long-term debt |
| WHR | Jul 28, 2025 ($1.75 → $0.90, -48.6%) | Q2 2026 ($0.90 → $0.00, -100.0% cum.) | ~9.0 months | FY25 FCF shrank to $81M vs. $300M dividends paid (370.4% payout) |
| MPT | Aug 21, 2023 ($0.29 → $0.15, -48.3%) | Aug 19, 2024 ($0.15 → $0.08, -72.4% cum.) | 12.0 months | Steward Health Care bankruptcy cut OCF from $739M (FY22) to $245M (FY24) |
| WBA | Jan 4, 2024 ($0.48 → $0.25, -47.9%) | Jan 30, 2025 ($0.25 → $0.00, -100.0% cum.) | 12.9 months | FY24 FCF deteriorated further from +$141M to -$363M before buyout |
| INTC | Feb 22, 2023 ($0.365 → $0.125, -65.8%) | Aug 1, 2024 ($0.125 → $0.00, -100.0% cum.) | 17.3 months | Foundry CapEx drove 4 straight negative FCF years (-$9.4B to -$4.9B) |
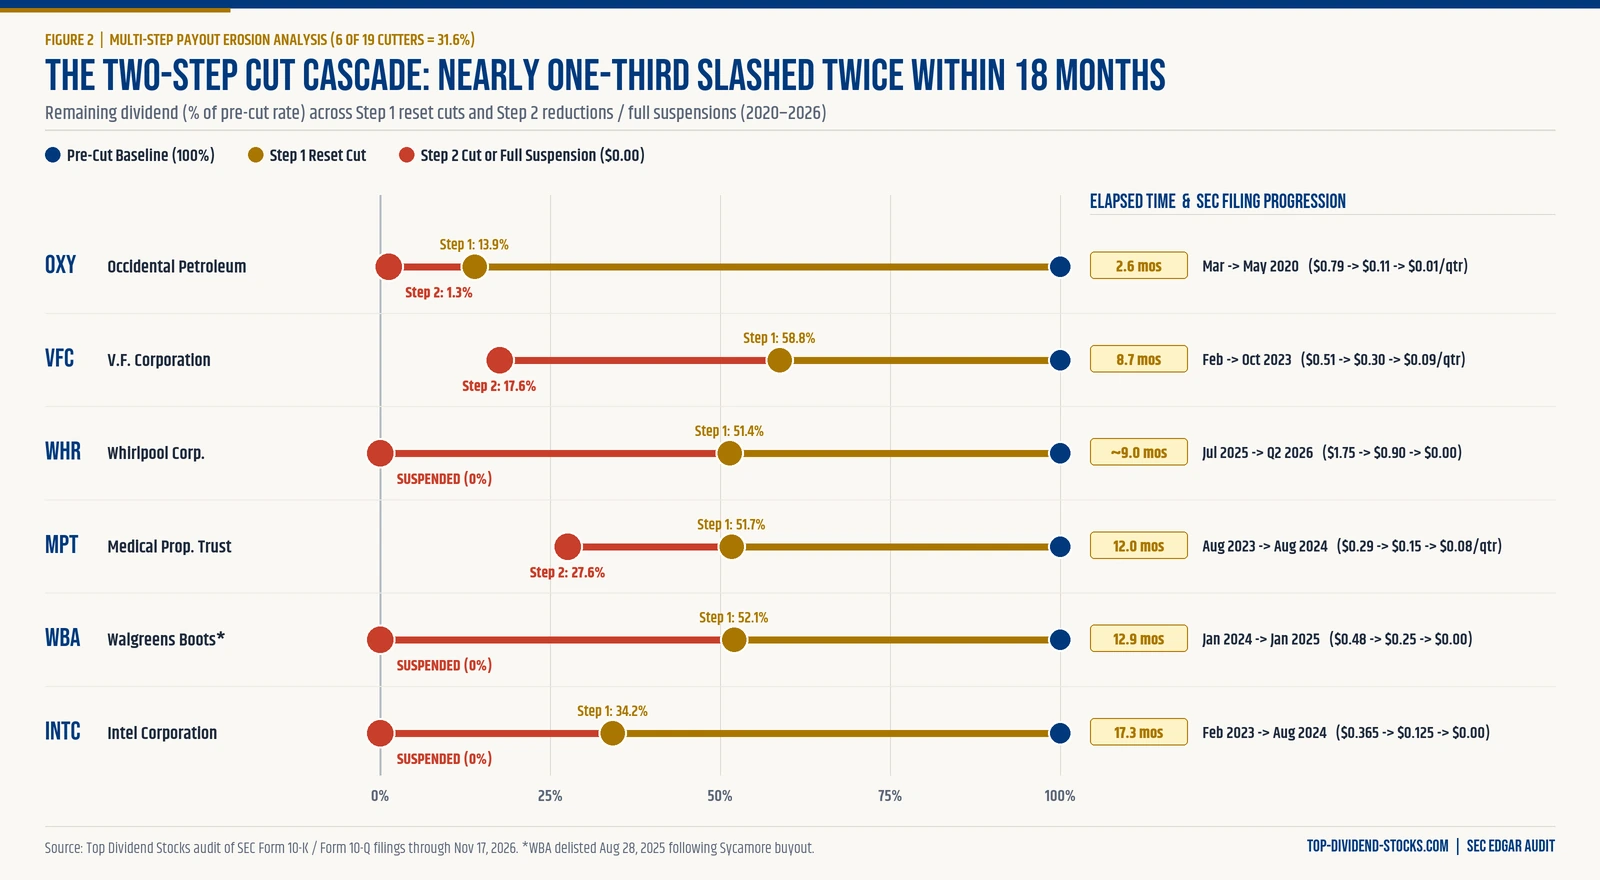
Whirlpool (WHR) provides the sharpest real-time case study of 2025–2026. After maintaining a $1.75/quarter payout despite 104.9% FCF payout in FY2023 and 100.0% in FY2024, Whirlpool halved its quarterly payout to $0.90 in Q3 2025. Yet full-year FY2025 FCF still fell to just $81M against $300M in cash dividends (370.4% FCF payout, per WHR FY2025 Form 10-K). Following one final $0.90 payment in March 2026, the board suspended the common dividend entirely in Q2 2026 (WHR Q3 2026 Form 10-Q).
Active watchlist signal embedded in SEC filings: Newell Brands (NWL)—which cut 69.6% in May 2023 and remains frozen at $0.07/quarter—reported FY2025 Free Cash Flow of just $17M ($264M OCF minus $247M CapEx) against $120M in cash dividends paid (705.9% FCF payout) and $4,543M in long-term debt (NWL FY2025 Form 10-K). That filing profile closely mirrors the pre-suspension cash-flow strain observed in Walgreens and Whirlpool prior to their Step 2 suspensions.
3. Pre-Cut Cash-Flow Warnings vs. the 2026 Healthy-FCF Leverage Blind Spot
Conventional dividend-safety frameworks—including the four-metric screening process outlined in our guide to avoiding high-yield dividend traps—prioritize Free Cash Flow payout ratios below 70%–80%. Our SEC audit confirms that this screen catches the vast majority of operational collapses, but reveals a critical 2026 blind spot that FCF payout alone misses.
Operational FCF Collapse Cuts (n = 10): 90.0% Flashed Red in SEC Filings
Among the 10 companies whose cuts stemmed from operational deterioration, 9 of 10 (90.0%) triggered an explicit cash-flow red flag (FCF payout ≥ 100%, NEG FCF, or REIT cash dividends exceeding operating cash flow) within the two fiscal years preceding the cut:
- Immediate negative FCF before cutting (4): V.F. Corp. (-$808.0M FY23), Intel (-$9,411M FY22), Dow Inc. (-$26M FY24, deteriorating to -$1,447M in FY25), and Newell Brands (-$584M FY22).
- FCF payout ≥ 100% in the pre-cut or prior fiscal year (4): Walgreens (1,176.6% FY23), Kohl’s (122.0% FY24), Whirlpool (104.9% FY23 and 100.0% FY24), and Estée Lauder (127.1% FY23 before dipping to 65.7% FY24 and falling to $670M FCF in FY25).
- REIT OCF shortfall (1): Medical Properties Trust paid $615M in FY23 cash dividends against $506M in operating cash flow (121.5%).
- Sole 2-year exception (1): Leggett & Platt posted 62.4% FCF payout in FY23 and 67.2% in FY22, though it had already flashed a 132.5% FCF payout warning three years earlier in FY21 ($218M dividends on $165M FCF).
The 2026 “Healthy-FCF Leverage Cut” Blind Spot (CAG & FLO)
Both major Consumer Staples dividend cuts in mid-2026 broke the traditional FCF-payout rulebook:
- Flowers Foods (FLO, cut -49.5% on May 21, 2026): In FY2025 (ended January 3, 2026), Flowers Foods generated $319.1M in GAAP Free Cash Flow ($446.2M OCF minus $127.1M CapEx) and paid $209.3M in common dividends—a seemingly manageable 65.6% FCF payout ratio. However, funding the Simple Mills acquisition pushed Long-Term Debt up +32.7% year-over-year from $1,021.6M to $1,355.6M against just $12.1M in cash ($1,343.5M Net LTD, or 4.2x FCF; FLO FY2025 Form 10-K).
- Conagra Brands (CAG, cut -50.0% on July 15, 2026): In FY2026 (ended May 31, 2026), Conagra generated $978.7M in Free Cash Flow ($1,402.1M OCF minus $423.4M CapEx) against $669.7M in dividends—a 68.4% FCF payout ratio. Yet Conagra carried $6,456.0M in long-term debt against $218.0M in cash ($6,238.0M Net LTD, or 6.4x Free Cash Flow; CAG FY2026 Form 10-K). After paying $669.7M to shareholders, only $309.0M of residual FCF remained to reduce more than $6.2B of net long-term debt.
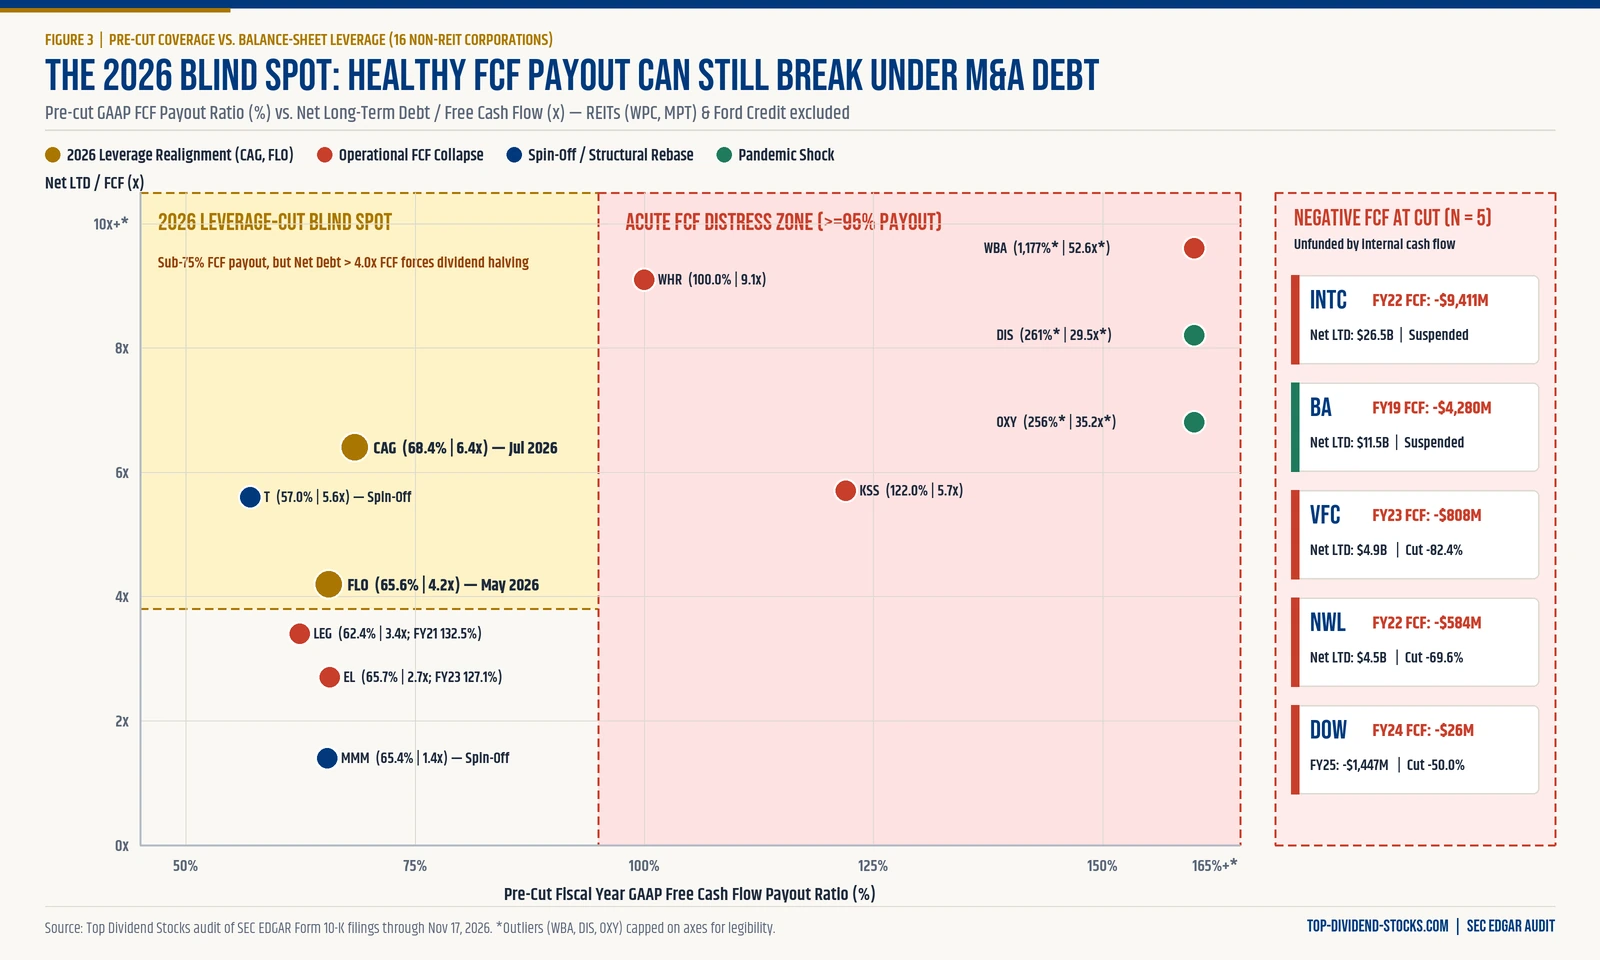
Analytical implication: In a 4%–5% Treasury refinancing environment (examined across income asset classes in our 2026 Dividend-Duration Stress Test), Residual Free Cash Flow After Dividends relative to Net Debt matters just as much as the standalone FCF payout ratio. A 65%–70% FCF payout ratio offers far less safety when Net Long-Term Debt exceeds 4.0x–6.0x FCF.
4. Avoiding the REIT Screening Trap: AFFO and Normalized FFO vs. GAAP FCF
Automated dividend screeners frequently misclassify equity REITs because standard GAAP cash-flow statements deduct property acquisitions inside investing cash flows. Our database pairs two contrasting REIT cuts—W. P. Carey (WPC) and Medical Properties Trust (MPT, formerly MPW)—to show why REIT coverage must be audited on SEC-disclosed AFFO or Normalized FFO (as detailed in our 2026 High-Dividend REITs analysis):
- W. P. Carey (WPC) — Clean Structural Rebase Followed by 11 Straight Raises: On a naive GAAP OCF minus CapEx basis, W. P. Carey appears cash-flow negative in 2021 (-$380M), 2022 (-$142M), 2023 (-$138M), and 2025 (-$375M) purely because it acquires industrial properties. On its actual SEC-reported AFFO basis (WPC FY2025 Form 10-K), W. P. Carey generated $1,035.9M ($4.70/share) in FY2024 and $1,098.2M ($4.97/share) in FY2025 against $790M in FY2025 dividends paid—a sustainable 71.9% AFFO payout ratio. Following its December 2023 office exit (NLOP) rebase (-19.7%, from $1.071 to $0.86/quarter), WPC raised its dividend every single quarter through Q3 2026 ($0.95/quarter, recovering 88.7% of its pre-cut rate).
- Medical Properties Trust (MPT, fka MPW) — Severe Tenant-Driven Erosion: Unlike WPC’s voluntary portfolio repositioning, MPT suffered major hospital tenant bankruptcies (Steward Health Care and Prospect Medical). SEC-reported Normalized FFO fell from $1.82/share (FY2022) and $1.59/share (FY2023) to $0.80/share ($482.7M, FY2024) and $0.58/share ($346.3M, FY2025) (MPT FY2025 Form 10-K). After two cuts ($0.29 → $0.15 → $0.08/quarter, -72.4% cumulative), MPT changed its NYSE ticker to MPT in 2026 and nudged its payout +12.5% to $0.09/quarter (56.9% FY2025 NFFO payout)—still just 31.0% of its pre-cut income.
5. Original Analysis: Post-Cut Recovery Taxonomy Across 4 Trigger Archetypes
Not all dividend cuts behave identically. Grouping all 19 SEC-verified cutters by their primary structural catalyst reveals sharp divergence in both cut severity and multi-year payout recovery:
| Trigger Archetype | Companies (n) | Tickers | Median Cum. Cut | Pre-Cut 2-FY Distress | Any Post-Cut Raise | Full Recovery (≥100%) | Delisted | Median % of Pre-Cut (Nov 2026) |
|---|---|---|---|---|---|---|---|---|
| Pandemic / Exogenous Shock | 4 | DIS, OXY, F, BA | -100.0% | 3 / 4 (75.0%) | 3 (DIS, OXY, F) | 2 (50.0%) | 0 | 67.7% |
| Spin-Off / Structural Rebase | 3 | MMM, T, WPC | -46.6% | 0 / 3 (0.0%) | 2 (WPC, MMM) | 0 (0.0%) | 0 | 53.4% |
| Leverage Realignment (2026) | 2 | CAG, FLO | -49.8% | 0 / 2 (0.0%) | 0 (2026 cuts) | 0 (0.0%) | 0 | 50.2% |
| Operational FCF Collapse | 10 | WBA, VFC, LEG, INTC, WHR, DOW, MPT, NWL, KSS, EL | -78.7% | 9 / 10 (90.0%) | 1 (MPT) | 0 (0.0%) | 2 (20.0%) | 21.3% |
| All Audited Cutters | 19 | Full 2020–2026 Cohort | -75.0% | 12 / 19 (63.2%) | 6 (31.6%) | 2 (10.5%) | 2 (10.5%) | 35.4%* |
Three Structural Lessons for Income Portfolio Construction
- Operational collapses inflict lasting income scarring: Across the 10 Operational FCF Collapse issuers, the median cut was -78.7%, zero (0 of 10) have fully recovered, only one (MPT) has delivered even a modest increase, and two (WBA, LEG) disappeared via M&A delisting. Even when cash flow rebounds—as at Kohl’s, where FY2025 FCF recovered to $1,008M against $56M in dividends (5.6% payout)—boards typically prioritize debt reduction over restoring legacy dividend rates.
- Spin-off rebases preserve dividend growth only when balance sheets are clean: W. P. Carey (-19.7% rebase → 11 consecutive quarterly raises) and 3M (-53.6% rebase → 2 annual raises) resumed growth relatively quickly, whereas AT&T (-46.6% rebase) entered its spin-off carrying $167.5B in long-term debt and has kept its payout flat for more than four years.
- Exogenous-shock suspensions are the only archetype with proven full restoration—if core franchise cash flows survive: Disney ($10,572M FY2026 FCF, 24.9% payout) surpassed its pre-COVID payout 6.5 years after suspending, and Ford restored its $0.60 regular base within 2.5 years. Boeing (BA) stands as the cautionary outlier: with negative Free Cash Flow in 5 of 7 fiscal years from 2019 through 2025 (-$1,877M in FY2025) alongside $53,848M in long-term debt, Boeing remains suspended at $0.00 after 6.7 years.
Practical Tool Specification: Dividend-Cut Stress & Coverage Calculator
Implementation Notice: The framework below is a technical build specification designed for future interactive deployment under Tools & Resources—it is not an active widget embedded on this page.
To screen any U.S. dividend stock for both traditional FCF distress and the 2026 Healthy-FCF Leverage Blind Spot using five SEC Form 10-K inputs (Issuer Type, OCF/CapEx or REIT AFFO, Annual Cash Dividends Paid, Long-Term Debt minus Cash, and a -10% to -40% OCF Stress Shock):
- Low Structural Cut Risk: FCF Payout < 65% (REIT AFFO < 75%) AND Net Long-Term Debt < 3.0x FCF AND Stressed (-20% OCF) Payout < 90%.
- 2026 Leverage-Realignment Watch (CAG/FLO Zone): FCF Payout 55%–80% BUT Net Long-Term Debt > 4.0x FCF (or > 12 years of residual FCF after dividends required to retire net debt).
- Acute Cut / Cascade Risk (WBA/WHR/DOW Zone): FCF Payout ≥ 95%, Negative FCF, or Stressed (-20% OCF) Payout > 115%.
Methodology, Accounting Reconciliations & Limitations
This dataset covers 19 high-profile U.S. public companies that executed material common stock dividend cuts (≥19%) or complete suspensions between March 1, 2020 and July 31, 2026. All financial figures were extracted from official SEC EDGAR Form 10-K and Form 10-Q filings through November 17, 2026, and cross-checked programmatically against raw cash-flow statements and filing HTML text.
Open Calculation Ledger & Mandatory Financial Definitions (Formulas, GAAP/REIT Adjustments)
- Annualized Regular DPS: 4 × regular quarterly declared DPS (or 2 × semi-annual declared DPS for Disney). One-time supplemental/special dividends (e.g., Ford’s $0.65, $0.18, and $0.15 supplementals in 2023–2025) are excluded from regular base recovery rates.
- Cumulative Cut %: ((Trough Annualized DPS − Pre-Cut Annualized DPS) / Pre-Cut Annualized DPS) × 100. Captures multi-step cascades in full.
- Free Cash Flow & FCF Payout Ratio (17 Non-REIT Corporations): GAAP Operating Cash Flow minus GAAP Capital Expenditures (mapped to PaymentsForCapitalImprovements for V.F. Corp. and Continuing Operations OCF for Disney FY19). Common cash dividends are isolated from Berkshire Hathaway preferred stock dividends for Occidental Petroleum ($2,585M common vs. $2,624M total in FY19). When FCF ≤ 0, ratio is classified as NEG FCF.
- REIT Coverage Basis (WPC & MPT): Evaluated on SEC-reported Adjusted Funds From Operations (AFFO) for W. P. Carey and Normalized FFO for Medical Properties Trust so growth property acquisitions do not distort coverage.
- Cash Yield vs. Total Return: Dividend yield measures cash distributed relative to share price, whereas Total Return combines price change plus reinvested cash dividends. For spin-off rebases (T, MMM, WPC), shareholders also received distributed equity in Warner Bros. Discovery, Solventum, or Net Lease Office Properties.
Key Limitations & Cross-Border Tax Context
- Curated large/mid-cap benchmark: Summary statistics (10.5% full recovery, 31.6% two-step cascade) describe this 19-company U.S. benchmark rather than an exhaustive census of all small-cap, BDC, MLP, or non-U.S. dividend cuts since 2020.
- Right-censoring on 2025–2026 cuts: Issuers that cut in 2025 (DOW, KSS) or mid-2026 (CAG, FLO, WHR suspension) have had fewer than 18 months to attempt recovery; their post-cut trajectories will be updated quarterly.
- International & Swiss investor note: Dividend cuts do not change statutory U.S. withholding tax rates (30% default; 15% under U.S.–Switzerland and most EU treaties via Form W-8BEN), but lower payouts reduce net dividend cash flow while capital losses from pre-cut drawdowns carry asymmetric tax treatment across European jurisdictions (see our Dividend Withholding Tax by Country reference).
Source-Backed Frequently Asked Questions
How often do stocks fully restore their dividend after a dividend cut?
In our SEC EDGAR audit of 19 major U.S. dividend cuts from 2020 through November 19, 2026, only 2 of 19 companies (10.5%) have fully restored or surpassed their pre-cut regular annual dividend: The Walt Disney Company ($2.00/share declared November 17, 2026, or 113.6% of its pre-pandemic $1.76 rate) and Ford Motor Company (100.0% regular base restored). Across the 15 non-pandemic cuts between 2022 and 2026, zero (0.0%) have returned to their pre-cut rate.
Why did Conagra Brands and Flowers Foods cut their dividends in 2026 despite positive Free Cash Flow?
Both cuts reflect the 2026 Healthy-FCF Leverage Cut pattern. Per their SEC Form 10-K filings, Flowers Foods posted a 65.6% FY2025 FCF payout ratio ($209.3M dividends on $319.1M FCF) and Conagra posted a 68.4% FY2026 FCF payout ratio ($669.7M dividends on $978.7M FCF). However, elevated M&A long-term debt ($6,456.0M at Conagra; $1,355.6M at Flowers Foods following the Simple Mills acquisition) prompted both boards to halve payouts to accelerate deleveraging.
Which former Dividend Aristocrats and Dividend Kings cut their dividends between 2022 and 2026?
Five official former Dividend Aristocrats or Kings in our database cut payouts: AT&T (36-year streak, cut -46.6% in Feb 2022), V.F. Corp. (50-year King, cut -82.4% across 2023), Walgreens Boots Alliance (47-year Aristocrat, cut Jan 2024, suspended Jan 2025, delisted Aug 2025), Leggett & Platt (52-year King, cut -89.1% Apr 2024, delisted Aug 2026), and 3M Company (64-year King, rebased -53.6% May 2024). W. P. Carey and Flowers Foods also cut at year 24 just shy of Aristocrat status.
What is a Two-Step Cut Cascade and how common is it?
A Two-Step Cut Cascade occurs when a board slashes its dividend once, fails to arrest cash-flow deterioration, and cuts again or suspends to $0.00 within 3 to 18 months. In our 19-company SEC audit, 6 of 19 companies (31.6%) underwent a two-step cascade: OXY, VFC, MPT, WBA, INTC, and WHR (which cut to $0.90/quarter in Q3 2025 and suspended completely in Q2 2026).
Why shouldn’t investors use standard Free Cash Flow to screen REITs for dividend cuts?
Standard GAAP Free Cash Flow (Operating Cash Flow minus Capital Expenditures) treats property acquisitions as capital expenditures, making growing equity REITs appear cash-flow negative. W. P. Carey showed negative GAAP OCF minus CapEx in FY2025 (-$375M) while generating $1,098.2M in SEC-reported AFFO (71.9% payout) and raising its dividend 11 consecutive quarters. Investors should evaluate REITs on AFFO or Normalized FFO instead.
Is a stock safe to buy immediately after a 50% dividend cut?
Historical filing data suggests caution rather than automatic bargain-hunting. Nearly one-third (31.6%) of audited cutters reduced or eliminated their payout a second time, and 42.1% remained frozen at their lower rate for years. Before entering a post-cut turnaround, verify that post-cut cash dividends represent less than 50% of normalized FCF (or <70% of REIT AFFO) and that residual cash flow meaningfully reduces Net Long-Term Debt each year.
Did Disney officially surpass its pre-COVID dividend in 2026?
Yes. According to The Walt Disney Company’s FY2026 Form 10-K filed with the SEC on November 17, 2026, Disney paid $1.50/share in FY2026 ($2,634M cash dividends on $10,572M FCF, a 24.9% payout ratio) and declared a $2.00/share annual dividend ($1.00 payable January 22, 2027 and $1.00 payable July 13, 2027)—surpassing its pre-pandemic $1.76/share payout by 13.6%.
Last Updated & How to Cite This Dataset
- Last Audited: November 19, 2026 (SEC Form 10-K/10-Q filings through November 17, 2026).
- Next Scheduled Update: March 2027 (post-FY2026 Form 10-K season).
- Suggested Citation: Asel, “Dividend Cuts & Recoveries Database (2020–2026): SEC Filing Audit of 19 Major U.S. Payout Cuts & Fallen Aristocrats,” Top Dividend Stocks, November 19, 2026, https://top-dividend-stocks.com/dividend-cuts-recoveries-database/.
Related Primary-Source Research on Top Dividend Stocks: Explore our Best Dividend Stocks 2026 pillar, our Highest Dividend Yields Survival Study, and our 2026 Dividend-Duration Stress Test.